Understanding the Normal Yield Curve: An Essential Tool for Institutional Investors

Understand the significance of yield curves for institutional investors. Learn how they form, interpret them, and apply this knowledge in investment strategies.
Introduction to Yield Curves
A yield curve is a graphical representation of the relationship between the maturity date of debt obligations (i.e., bonds) and their corresponding yields, or interest rates. The shape of this curve is considered an essential indicator of future economic conditions for institutional investors. A normal yield curve is characterized by its upward slope, where short-term debt instruments carry lower yields than long-term debt instruments of the same credit quality. This relationship reflects the market’s expectation of increased compensation for taking on greater risks associated with longer investment horizons and uncertain economic conditions.
The concept of a normal yield curve is fundamental to understanding interest rate trends and making informed investment decisions, as it provides valuable insights into how various debt securities are priced based on their time to maturity. In this section, we delve deeper into the meaning and significance of the normal yield curve. We’ll explore its components, interpretation, implications for investors, and historical context.
Understanding Yield Curves: An Essential Tool for Institutional Investors
The yield curve plays a crucial role in understanding interest rates, assessing economic conditions, and implementing investment strategies. As the shape of the yield curve changes, it can provide important clues about future short-term interest rate movements and overall trends within financial markets. In this article, we will take a closer look at the normal yield curve, which is the most common yield curve shape observed in healthy economies, and discuss its significance for institutional investors.
Stay tuned as we examine the components of a yield curve, interpret its slope, and explore how it can serve as an indicator for economic conditions. We will also discuss the benefits of utilizing this knowledge to inform investment decisions and compare normal, flat, and inverted yield curves in more detail.
In the following sections, we will cover topics such as:
- Components of a Yield Curve
- Understanding the Normal Yield Curve
- Interpreting the Slope of the Yield Curve
- Yield Curves as an Indicator
- Benefits for Institutional Investors
- Comparing Normal, Flat and Inverted Yield Curves
- Analyzing the Impact on Bonds and Stocks
- Historical Perspective on Yield Curves
- FAQs: Frequently Asked Questions about Normal Yield Curves.

Components of a Yield Curve
A yield curve is an essential tool for understanding the relationship between interest rates and various debt instruments’ maturities within a specific economy. It provides valuable insights into market expectations, economic conditions, and investor behavior. In its simplest form, the components of a yield curve consist of short-term interest rates and long-term interest rates.
Short-Term Interest Rates: Short-term interest rates refer to borrowing costs for debt instruments with shorter maturities, typically ranging from overnight loans to those with one to three years until they mature. These rates are influenced by the Federal Funds Rate, which is set by central banks like the Federal Reserve in the United States. The short end of the yield curve is often considered more sensitive to central bank policies as these rates directly impact near-term borrowing costs for businesses and consumers.
Long-Term Interest Rates: On the other hand, long-term interest rates are those associated with debt instruments that have extended maturities, usually five years or more. These investments carry greater risks due to their longer durations and exposure to changes in economic conditions, such as inflation or potential shifts in monetary policy. As a result, long-term interest rates typically yield higher returns compared to their shorter counterparts, providing compensation for the added risk and time value of money.
Understanding the normal yield curve:
The normal yield curve is characterized by an upward slope, indicating that short-term interest rates are lower than long-term interest rates. This shape is the most commonly observed in financial markets due to market expectations of higher yields over longer periods, which generally compensate investors for the increased risk and opportunity cost. The positive or upward sloping yield curve reflects the compensation investors require for investing their capital for extended durations while relinquishing their ability to earn a return on their capital through other investments in the interim. This reward for assuming greater risk is significant, as changes in interest rates have substantial implications for bond issuers and investors alike. Additionally, it acts as an indicator of economic growth since longer-term bonds are more sensitive to overall economic conditions and inflation expectations.

Understanding the Normal Yield Curve
The normal yield curve is an essential financial concept that reflects the relationship between short-term and long-term interest rates for various maturities in a given economy. This section aims to clarify the significance of a normal yield curve, describing its features, formation, and role as an indicator for investors.
In the context of fixed income securities, the normal or upward-sloping yield curve represents the market expectation that long-term investments come with higher yields compared to short-term alternatives of the same credit quality. This is due to the additional risks associated with long-term bonds and the opportunity cost of investing money for extended periods, making them less liquid than their shorter counterparts.
When a yield curve displays an upward slope, it signifies optimistic market sentiment towards future interest rate trends. A normal yield curve is generally indicative of economic growth, as investors are willing to accept lower yields on short-term securities in anticipation of future yield increases with longer-term investments. It’s important to note that this upward slope can also serve as a valuable predictor for potential future interest rate movements and overall economic conditions.
By analyzing the normal yield curve, investors can gain insights into the current state of the economy, market trends, and even the likelihood of upcoming recessions or expansions. The shape of the curve can change, giving rise to flat or inverted yield curves; understanding the significance of these variations is crucial for informed investment decisions.
In conclusion, the normal yield curve plays an indispensable role in providing context for interest rate trends and their implications on various investments. As a critical tool for institutional investors, its analysis can help inform strategic asset allocation decisions and capitalize on market fluctuations. Next, we’ll explore how to interpret the slope of the yield curve further and discuss the advantages that come with this insightful financial concept.
Interpreting the Slope of the Yield Curve
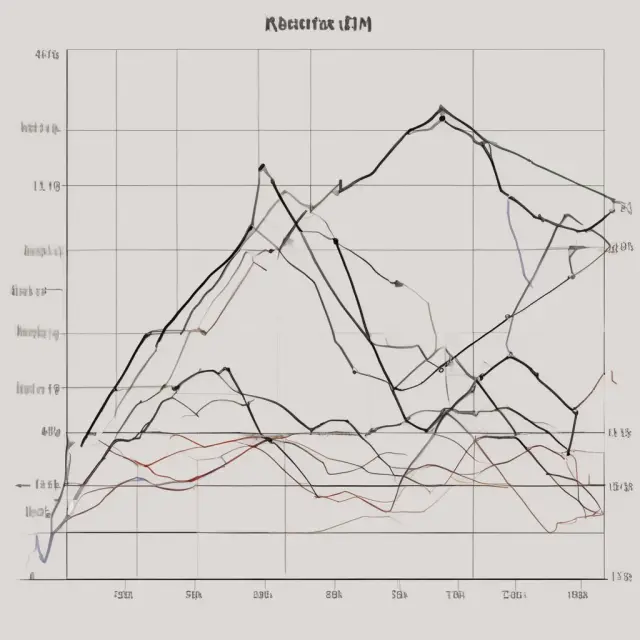
The slope of the yield curve plays a crucial role in understanding future interest rate movements and economic conditions. An upward-sloping yield curve, which is the most common shape seen, indicates that short-term debt instruments have lower yields than long-term debt instruments of equivalent credit quality. The normal yield curve reflects the market’s expectation for more compensation in terms of yield as an investor takes on longer maturity dates. This is due to increased risks associated with extended investment horizons and a reduced opportunity for funds to be used elsewhere.
When interpreting the slope of the yield curve, it is essential to consider its implications for future interest rate movements and economic conditions. An upward-sloping yield curve often suggests an expectation that short-term interest rates will rise in the future due to various factors such as inflation pressures or central bank policies. Conversely, a downward-sloping yield curve predicts lower future interest rates.
Understanding the shape of the yield curve is significant for institutional investors because it can serve as a reliable indicator of overall economic conditions and market trends. For instance, an upward-sloping normal yield curve may indicate a strong economy with expanding growth prospects, while a downward-sloping curve could suggest an impending recession.
It’s important to note that the slope of the yield curve can change over time due to various economic factors. As such, institutional investors need to stay informed about the latest yield curve trends and interpret their implications for their investment portfolios. For instance, during periods of economic expansion, the normal upward-sloping yield curve may shift towards a flatter or even inverted shape as investors move funds from riskier assets to safer alternatives due to rising interest rates or increased concerns over economic instability.
In conclusion, understanding the slope of the yield curve is essential for institutional investors looking to make informed decisions about their investment strategies based on the current economic conditions and future interest rate trends. By interpreting the shape and changes in the yield curve, institutional investors can identify potential opportunities and risks, adjusting their portfolios accordingly to maximize returns and minimize losses.
FAQs:
Q: What happens when the yield curve is downward sloping?
A: When the yield curve is downward sloping, short-term debt instruments have higher yields than long-term debt instruments of equal credit quality. This shape can indicate an impending recession or economic downturn as investors move their funds into safer investments.
Q: How does a normal upward-sloping yield curve impact bond and stock markets?
A: A normal upward-sloping yield curve typically implies higher interest rates in the future, which may lead to lower bond prices due to the inverse relationship between bond yields and bond prices. In contrast, stocks may perform better as investors seek out higher returns from equities when bond yields rise.
Q: How does a flat yield curve differ from a normal yield curve?
A: A flat yield curve demonstrates that short-term and long-term bonds offer essentially the same yields. This shape can indicate that the economy is approaching a recession as investors move their funds into safer, less risky assets to protect their capital.
Q: What impact does an inverted yield curve have on the economy?
An inverted yield curve occurs when short-term interest rates are higher than long-term interest rates. This shape has historically been a reliable predictor of economic recessions as it signals that investors anticipate short-term interest rates to fall in the near future.

Yield Curves as an Indicator
The normal yield curve’s most crucial function lies in its ability to act as a reliable economic indicator. By observing the shape of the yield curve, investors and financial analysts can infer essential information about current market trends and potential future changes within the economy.
A yield curve represents the relationship between various yields on bonds with differing maturities. The primary indicator used to analyze this relationship is the slope of the curve – whether it’s upward sloping or downward sloping. The direction of the slope offers valuable insights into the market’s outlook regarding future interest rate movements and economic conditions.
An upward-sloping yield curve indicates an expectation for higher interest rates in the future. This can be interpreted as a sign of confidence in the economy, suggesting that investors are optimistic about its growth potential. An upward slope also implies that the risk associated with longer-term investments is greater than that of shorter-term securities due to the added uncertainty and volatility.
Conversely, a downward-sloping yield curve suggests lower interest rates in the future. This scenario can indicate investor concerns regarding economic weakness or an impending recession. In this situation, investors may prefer the perceived safety of short-term bonds over longer-term investments, causing yields on shorter maturities to rise relative to those on longer terms.
Historically, yield curves have proven effective in predicting recessions and expansions. For example, during each of the last seven recessions, there was an inverted yield curve preceding the economic downturn by 12-24 months (see Figure 1). This inverse relationship has become a well-established indicator of potential economic challenges ahead.
Figure 1: Historical Yield Curve Shapes and Recessions
In summary, the normal yield curve’s shape offers valuable insights into the economy and market trends. Its slope can serve as an essential predictor of future interest rate movements and potential recessions or expansions. By carefully analyzing the shape and direction of the yield curve, institutional investors can make informed decisions regarding their investment strategies, capital allocation, and risk management.
FAQs:
Why does the normal yield curve slope upwards?
– The upward slope in a normal yield curve occurs as a result of the increased risk involved with long-term investments. Longer maturities expose investors to greater uncertainty regarding interest rate movements and potential defaults, necessitating higher yields to compensate.
What happens when the yield curve is flat or inverted?
– When the yield curve is flat, it suggests that returns on shorter and longer term investments are essentially equal. This can be a sign of economic instability preceding a recession. An inverted yield curve occurs when short-term yields are higher than long-term yields – a rare but reliable indicator of an impending recession.
How is the normal yield curve formed?
– The normal yield curve is not produced by any single entity or government, but instead represents the collective expectations and knowledge of the entire market regarding future interest rates. Its shape reflects investors’ assessment of risk and potential returns based on maturity dates.

Benefits for Institutional Investors
The normal yield curve is an essential tool for institutional investors seeking to optimize their portfolios and capitalize on market trends. By understanding the shape and implications of a normal yield curve, institutional investors can make informed decisions regarding asset allocation, risk management, and investment strategies.
An upward sloping yield curve signifies that longer-term bonds offer higher yields compared to short-term equivalents. This differential yield is a result of the increased risks associated with long-term investments and the time value of money. The compensation for these risks can potentially lead to significant returns for institutional investors.
Institutional investors can employ several strategies based on their understanding of the normal yield curve:
1. Fixed Income Investments: By investing in bonds, institutional investors can take advantage of higher yields available at longer maturities. However, they must consider the associated risks and potential volatility in bond markets to ensure a balanced portfolio.
2. Interest Rate Risk Management: Institutional investors can hedge their interest rate risk by investing in long-term bonds when short-term rates are low but expected to rise. Conversely, if they believe short-term rates will remain low or decrease, they may choose to invest in shorter term bonds.
3. Arbitrage Opportunities: Institutional investors can seek arbitrage opportunities by exploiting temporary yield differences between securities of different maturities. For instance, they might buy a security with a lower yield and simultaneously sell another security with a higher yield. This strategy requires significant resources, expertise, and market knowledge to execute efficiently.
4. Duration Management: Institutional investors can manage the duration of their bond portfolio to adapt to changing interest rates and economic conditions. By adjusting the average maturity of bonds in their portfolios, they can balance risk and return while ensuring that their investments align with their investment objectives.
In conclusion, a normal yield curve offers institutional investors several advantages. By understanding the shape and implications of this curve, investors can make informed decisions regarding asset allocation, risk management, and investment strategies. With the ability to effectively navigate bond markets and capitalize on market trends, institutional investors gain a significant edge in achieving their financial objectives.
Furthermore, it’s important to note that yield curves are not constant; they change as economic conditions evolve. Therefore, institutional investors must remain vigilant and continuously update their understanding of the yield curve to adapt to changing market dynamics.

Comparing Normal, Flat and Inverted Yield Curves
A yield curve can take various shapes, with the normal yield curve being the most common one. This section explores the differences between normal, flat, and inverted yield curves to help institutional investors understand their implications for interest rates and economic conditions.
A Normal Yield Curve: When it comes to yield curves, the normal curve is characterized by an upward slope with short-term debt instruments yielding lower returns than long-term investments of equal credit quality. This is considered a “normal” situation as longer-term bonds carry more risk – they are exposed to interest rate changes and potential defaults. Longer investment periods also limit liquidity for investors, so they demand higher yields in compensation.
A Flat Yield Curve: A flat yield curve appears when the difference between short-term and long-term yields is minimal. This indicates a market expectation of similar returns across various maturities, often seen as an economy approaches a recession. At this stage, investors may move their funds into lower risk options to protect their capital, which can cause short-term interest rates to increase while long-term rates remain stable, leading to the flattened curve.
An Inverted Yield Curve: An inverted yield curve is an anomalous situation where short-term yields surpass those of longer-term securities. This shape signals that investors expect future interest rates to decline, and can be a strong indicator of an impending recession or an economic downturn. During this phase, investors may prefer the safety of long-term investments over short-term ones, driving up the prices (and yields) of longer bonds and lowering those of shorter bonds.
Institutional investors play a significant role in understanding these yield curve shapes and their implications for interest rates and market trends. By staying informed about yield curves and the various shapes they can take, investors can adjust their investment strategies accordingly to capitalize on shifting economic conditions and anticipate potential changes in interest rates.

Analyzing the Impact on Bonds and Stocks
A normal yield curve is characterized by its upward slope, with short-term interest rates being lower than long-term interest rates. This shape indicates that investors generally expect higher yields for accepting longer investment horizons due to the added risks associated with longer investments. Let’s dive deeper into how a normal yield curve impacts bonds and stocks for institutional investors.
Bonds:
Investors buying government or corporate bonds are usually seeking a predictable return on their capital, often aiming for interest income that is higher than the prevailing inflation rate. A normal yield curve typically implies an upward bias in future short-term interest rates. For bondholders, this could lead to capital losses as the prices of their shorter maturity bonds decrease when new issues with similar credit quality are issued at slightly higher yields. Conversely, longer-dated bonds may experience price stability or even appreciation since investors demand a larger yield spread between long and short-term securities. Institutional bond investors can benefit from these dynamics by investing in the right mix of both long and short-term bonds based on their investment horizon, risk tolerance, and expected future interest rate movements.
Stocks:
A normal yield curve could also influence stock prices as various sectors have differing sensitivities to interest rates. Historically, sectors such as utilities, real estate, and consumer staples have tended to perform better during periods of lower long-term yields, while industries like financials, industrials, and energy have shown a stronger correlation with rising interest rate expectations. Institutional investors may use this information to construct portfolios that are well positioned for the economic environment indicated by the yield curve shape.
Furthermore, changes in the slope of the yield curve can provide valuable clues about potential shifts in monetary policy. For example, a flattening yield curve could indicate that central banks may be preparing to hike interest rates to cool down an overheating economy or combat inflationary pressures. In contrast, an inverted yield curve might suggest that investors are pricing in imminent economic downturns and that the central bank may soon adopt a more dovish stance. By keeping track of the shape of the yield curve, institutional investors can adapt their strategies to capitalize on the prevailing trends or changes in market conditions.
In conclusion, understanding the normal yield curve’s implications for bonds and stocks is essential knowledge for institutional investors. Armed with this insight, they can make informed investment decisions based on the current shape of the yield curve and its potential future movements.

Historical Perspective on Yield Curves
Understanding the historical context of yield curves adds further insight into their significance for financial markets and institutional investors. The normal yield curve, characterized by an upward slope, has been a typical shape throughout history. This curvature can be attributed to market expectations of higher interest rates in the future for long-term investments due to their inherent risks.
Historically, yield curves have proven to be reliable indicators of economic conditions and trends. For instance, during periods of strong economic growth, normal yield curves are prevalent as investors demand higher yields for longer-term securities. In contrast, yield curves may flatten or even invert when economic downturns approach.
A flat yield curve indicates that the returns on both shorter and longer term investments are almost identical. This condition is often seen as a precursor to an economic recession. During these times, investors become risk-averse and shift their funds towards safer, short-term assets, driving up prices and reducing yields for these securities. The flattening or inversion of the yield curve can serve as an early warning sign for potential changes in market conditions, allowing institutional investors to adjust their strategies accordingly.
An inverted yield curve, where short-term interest rates exceed long-term rates, is another historically significant occurrence. This shape represents a dramatic change from normal yield curves and suggests that investors expect near-term interest rates to fall significantly. When the yield curve inverts, it is typically seen as an indicator of an imminent recession or economic downturn.
Historically, many economic recessions have been preceded by significant changes in yield curves, particularly when they have become inverted. However, it’s important to note that an inverted yield curve does not guarantee a recession; rather, it increases the likelihood of one. Institutional investors can use this historical perspective to inform their investment strategies, considering both normal and abnormal yield curve shapes as indicators of potential market conditions and trends.
In conclusion, understanding the historical context of yield curves is crucial for institutional investors seeking to make informed decisions in finance and investment markets. The shape and movement of yield curves have served as reliable indicators of economic conditions, future interest rate trends, and overall market sentiment. By staying attuned to these patterns and factors, institutional investors can capitalize on valuable opportunities and minimize risks.

FAQs: Frequently Asked Questions about Normal Yield Curves
Question 1: What is the significance of the normal yield curve in finance and investment?
Answer: A normal yield curve, also known as an upward-sloping yield curve, is a critical tool for understanding future interest rate movements and economic conditions. It signifies that long-term bonds carry a higher yield compared to short-term ones due to increased risks. The normal yield curve’s slope helps investors assess potential returns on their investments based on the length of maturity.
Question 2: What is the difference between a normal and an inverted yield curve?
Answer: A normal yield curve, as discussed above, features an upward slope with long-term yields being higher than short-term ones. An inverted yield curve, however, has the opposite shape, where short-term yields are higher than long-term yields. An inversion of the yield curve is a potential warning sign for recessions as it indicates that investors believe the economy may be heading for a downturn.
Question 3: What factors influence the shape of yield curves?
Answer: Various factors can affect the shape of yield curves, including inflation expectations, economic growth, monetary policy, and investor sentiment. These factors are closely watched by financial analysts to assess potential trends in interest rates.
Question 4: How does a normal yield curve impact bond and stock markets?
Answer: A normal yield curve’s upward slope typically benefits longer-term bonds as they offer higher returns, making them attractive for investors seeking capital appreciation or income generation. For stocks, the direction of interest rates plays an important role in determining equity valuations and their relative attractiveness compared to bonds.
Question 5: What is the historical significance of normal yield curves?
Answer: Throughout history, normal yield curves have been useful indicators for predicting economic trends. For example, during the 1960s through the early 1980s, long-term yields usually remained higher than short-term ones, as the economy experienced relatively stable growth with occasional inflationary pressures. However, in the late 1980s and throughout the 1990s, a flatter yield curve emerged, reflecting lower inflation expectations and slower economic expansion. Most recently, during the global financial crisis of 2007-2008, the yield curve became inverted, foreshadowing the recession that followed.
 Next entry · No. 3,565Understanding Normal Profit: Differentiating Economic and Accounting Profit
See also
-
 No. 5,906
17 Oct 2025
21 min
Understanding Zero-Sum Games: Concepts and Applications in Finance and Investment
Business Finance
No. 5,906
17 Oct 2025
21 min
Understanding Zero-Sum Games: Concepts and Applications in Finance and Investment
Business Finance -
 No. 5,573
20 Sep 2025
19 min
Wage Push Inflation: An Overview for Institutional Investors
Business Finance
No. 5,573
20 Sep 2025
19 min
Wage Push Inflation: An Overview for Institutional Investors
Business Finance -
 No. 4,826
20 Jul 2025
21 min
A Comprehensive Guide to Conducting a SWOT Analysis for Institutional Investors
Business Finance
No. 4,826
20 Jul 2025
21 min
A Comprehensive Guide to Conducting a SWOT Analysis for Institutional Investors
Business Finance -
 No. 4,798
17 Jul 2025
20 min
Understanding the Substitution Effect in Finance and Investment
Business Finance
No. 4,798
17 Jul 2025
20 min
Understanding the Substitution Effect in Finance and Investment
Business Finance -
 No. 4,620
03 Jul 2025
20 min
Understanding Series I Bonds: A Comprehensive Guide for Institutional Investors
Business Finance
No. 4,620
03 Jul 2025
20 min
Understanding Series I Bonds: A Comprehensive Guide for Institutional Investors
Business Finance -
 No. 4,593
01 Jul 2025
23 min
Understanding Securities: An In-depth Analysis of Equity, Debt, and Hybrid Securities
Business Finance
No. 4,593
01 Jul 2025
23 min
Understanding Securities: An In-depth Analysis of Equity, Debt, and Hybrid Securities
Business Finance