Understanding the Price-to-Earnings (P/E) Ratio: Calculation, Formula, and Analysis

Learn the fundamentals of price-to-earnings (P/E) ratios through a comprehensive guide. Calculate, interpret, and compare P/E ratios for informed investment…
Introduction to P/E Ratios
The Price-to-Earnings (P/E) ratio serves as a crucial tool for investors and analysts alike when evaluating the value of a company’s shares, based on its Earnings Per Share (EPS). By calculating this important metric, one can determine whether a stock is overvalued or undervalued in comparison to similar companies within the same industry or against the broader market. In essence, a P/E ratio indicates the price an investor pays for every dollar of earnings a company generates, offering valuable insights into a stock’s relative valuation.
P/E Ratios: Formula and Calculation
The formula for calculating a P/E ratio involves dividing a company’s current market value per share by its EPS. This can be calculated using either historical (trailing) or projected (forward) earnings, depending on the information available to the investor or analyst. The trailing P/E uses past 12-month earnings, while forward P/E employs expected future earnings estimates.
To calculate the P/E ratio:
P/E Ratio = Market Value per Share / Earnings Per Share (EPS)
Using the historical EPS figure provides a clearer understanding of a company’s performance over an extended period, while forward P/E offers insights into future earnings potential. Both types of ratios play essential roles in analyzing a stock’s valuation. Understanding the nuances between trailing and forward P/E ratios is crucial for investors looking to make informed decisions.
Interpreting P/E Ratios: Overvalued or Undervalued?
The interpretation of P/E ratios can provide valuable insights into a company’s relative valuation. A high P/E ratio may indicate that the stock is overvalued, suggesting potential investment risks. Conversely, a lower P/E ratio might indicate an undervalued stock, offering opportunities for higher returns. It’s important to consider industry comparisons and historical trends when evaluating P/E ratios to gain a comprehensive understanding of a company’s valuation.
Long-Term Trends and Historical Perspective
Historical trends in the P/E ratio provide valuable context for investors, helping them make informed decisions about their investments. The long-term average P/E ratio for the S&P 500 is approximately 16x, representing a benchmark against which individual stocks can be evaluated. Understanding historical trends allows investors to identify deviations from the norm and make more informed investment decisions based on this knowledge.
Advantages and Disadvantages of P/E Ratios
While the P/E ratio is an essential tool for investors, it’s important to note that no single metric can provide a complete picture of a company’s value. Understanding both the advantages and disadvantages of using P/E ratios is crucial when making investment decisions. Factors such as market sentiment, growth prospects, and industry trends should also be considered in conjunction with this ratio.
Comparing Companies Using P/E Ratios
When comparing companies using P/E ratios, it’s essential to consider both absolute values and relative values, taking into account the differences between industries and individual company fundamentals. By analyzing these ratios, investors can gain valuable insights into a company’s competitive position within its industry and assess potential investment opportunities.
P/E Ratios and Market Sentiment
The relationship between investor sentiment and stock valuations as reflected in P/E ratios is an essential factor for investors to consider. Understanding the impact of market sentiment on stock prices can help investors make informed decisions and adjust their investment strategies accordingly.
Special Considerations for Utilities, Real Estate, and Tech Companies
Certain industries, such as utilities, real estate, and technology companies, present unique challenges when evaluating P/E ratios due to the nature of their business models and growth patterns. Understanding these nuances is crucial for investors looking to make informed decisions in these sectors.
P/E Ratios and Earnings Growth
The relationship between a company’s earnings growth and its P/E ratio offers valuable insights into investment opportunities and risks. By evaluating both historical trends and projected future growth, investors can identify potential undervalued or overvalued stocks based on their earnings potential.

P/E Ratio Formula and Calculation
The Price-to-Earnings (P/E) ratio is a vital financial metric for understanding the value of a company’s shares in relation to its earnings per share (EPS). This ratio can be calculated using both past (trailing) or projected future (forward) earnings. By examining a company’s P/E ratio, investors and analysts can make informed decisions regarding a stock’s relative value and potential growth prospects. In this section, we will delve deeper into the formula, calculation methods, and significance of P/E ratios.
Formula and Calculation
The P/E ratio is determined by dividing a company’s current stock price by its earnings per share (EPS). The EPS can be calculated based on either trailing 12-month data or projected future earnings (forward P/E).
Trailing P/E Ratio
To calculate the Trailing P/E ratio, divide the current market price of a company’s stock by its Earnings Per Share over the previous 12 months. This method is commonly used because it relies on historical data that has already occurred. For instance, if a company’s stock trades for $50 and its trailing EPS is $3, then the P/E ratio would be 16.67 ($50 / $3).
Forward P/E Ratio
The Forward P/E ratio is calculated by dividing a company’s current stock price by its estimated or projected earnings per share for the upcoming fiscal year. This approach is essential when evaluating growth prospects, as it provides an insight into the future expected earnings of the company and how they compare to the current valuation. For example, if a company’s stock trades for $60 and is projected to earn $4 in the next year, then its forward P/E ratio would be 15 ($60 / $4).
Interpreting P/E Ratios
A higher P/E ratio may indicate that investors expect significant growth or believe a company is overvalued. Conversely, a lower P/E ratio could suggest the opposite—potential undervaluation. However, it is essential to compare a company’s P/E ratio against its industry peers and historical averages to make accurate assessments.
Understanding Historical Trends
Historically, the long-term average P/E ratio for the S&P 500 has been around 16x. This benchmark is an essential point of reference when evaluating individual company valuations. However, it’s important to remember that P/E ratios are not static—they can fluctuate significantly over time due to changes in the business cycle and investor sentiment.
Advantages and Disadvantages
While the P/E ratio offers valuable insights into a company’s valuation, it also has its limitations. For instance, it does not account for factors like interest rates or differences in accounting standards across industries. Additionally, some companies may manipulate their earnings to create a more favorable P/E ratio.
Comparing Companies
When comparing companies using their P/E ratios, it’s essential to consider various factors, such as industry averages, historical trends, and growth prospects. It’s also crucial to recognize that the P/E ratio should be used in conjunction with other valuation metrics like Price-to-Book (P/B) or Price-to-Sales (P/S) ratios for a more comprehensive analysis.
In conclusion, understanding the price-to-earnings ratio is crucial for investors seeking to make informed decisions regarding a company’s stock valuation. By examining P/E ratios using historical data and forward projections, one can compare companies within their industry or benchmark against broader market averages. This knowledge empowers investors with essential insights into a company’s growth prospects and potential value.

Interpreting P/E Ratios: Overvalued or Undervalued?
Understanding the price-to-earnings (P/E) ratio is crucial for investors and analysts to determine a stock’s relative value. P/E ratios help investors identify overvalued or undervalued stocks based on the current share price compared to earnings per share (EPS). This section will explain how to interpret P/E ratios in the context of a company’s valuation and industry comparisons.
To begin with, a high P/E ratio could signify that a company’s stock is overvalued, or investors are expecting high growth rates in the future. On the other hand, a low P/E ratio might imply that the current stock price is undervalued or that the market isn’t giving the company the credit it deserves for its earnings potential. It is essential to remember, however, that P/E ratios should not be considered in isolation but instead within the context of the specific industry and the overall market.
Comparing a company’s P/E ratio against similar companies in the same industry or the broader market index like S&P 500 can provide valuable insights. For instance, if a stock’s P/E ratio is significantly higher than its industry peers, it may indicate that investors are expecting future growth beyond the sector average or that the company has unique competitive advantages.
On the other hand, a low P/E ratio compared to industry benchmarks could signify that the market is underestimating the potential earnings power of the company. It might be worth investigating further by looking into the reasons behind this discrepancy.
To illustrate, consider two hypothetical companies, XYZ and ABC, operating in the same industry:
- Company XYZ has a P/E ratio of 25x, while its industry average is around 18x. This may suggest that investors are expecting faster growth from XYZ compared to the rest of the sector. Alternatively, it could indicate overvaluation if there’s no clear catalyst for this growth.
- Company ABC has a P/E ratio of 13x, which is notably lower than the industry average. This disparity may signal an undervalued stock or suggest that investors have overlooked the company’s earnings potential.
Additionally, investors can compare the P/E ratios of individual companies against historical data to establish a sense of market trends and identify deviations from long-term averages. For example, if a technology company has consistently traded at a lower P/E ratio than its historical average, it may represent an opportunity for value investors.
It is important to remember that a low P/E ratio does not always equate to a good investment as there could be underlying issues with the company’s financials or business model that warrant further investigation. Conversely, high P/E ratios aren’t inherently negative, especially if a company has strong growth prospects.
In conclusion, interpreting P/E ratios requires a holistic view of the company’s fundamentals, industry comparisons, and historical context to determine whether a stock is overvalued or undervalued in relation to its earnings potential.

P/E Ratio History and Long-Term Trends
Understanding the historical trends in P/E ratios provides valuable context when evaluating a company’s current valuation using this metric. The price-to-earnings (P/E) ratio has been used as a stock evaluation tool since its introduction over a century ago, and observing long-term trends can help investors gauge the market sentiment and expectations. In this section, we delve into the history of P/E ratios and discuss their fluctuations over time.
The long-term average P/E ratio for the S&P 500 index has varied from a low of approximately 5x in 1917 to a high of over 120x in 2009, just before the financial crisis (Cowen, L.). The most widely quoted long-term average P/E ratio for the S&P 500 is around 16x. This means that on average, investors have paid $16 for every dollar of earnings generated by the companies in the index.
This measure is significant as it allows analysts to compare a company’s current P/E ratio against its industry peers or the broader market. For instance, if a company has a P/E ratio higher than the industry average and the long-term S&P 500 average, this could indicate that investors are expecting higher growth rates in the future, potentially making the stock overvalued based on current earnings alone.
Furthermore, studying historical trends can offer insights into market sentiment and economic conditions at different points in time. For example, P/E ratios tend to be lower during recessions, when investors are more risk-averse and cautious about valuations. In contrast, P/E ratios generally rise during periods of economic expansion as investor optimism grows.
The P/E ratio can also shed light on the relationship between a company’s earnings growth and its stock price. For instance, if a company’s earnings grow significantly over an extended period, its P/E ratio might remain constant or even decrease despite the rising share price, indicating that investors are willing to pay less for each dollar of earnings due to the improved profitability.
When considering historical trends in P/E ratios, it is important to differentiate between trailing and forward P/E ratios. Trailing P/E ratios reflect the current stock price relative to a company’s past earnings over the last 12 months, while forward P/E ratios represent investors’ expectations for future earnings over the next 12 months. As such, forward P/E ratios can provide useful information on growth prospects and help investors gauge market sentiment towards a specific stock or sector.
It is essential to keep in mind that historical trends do not necessarily predict future performance. While understanding long-term P/E ratio movements can offer valuable context when evaluating a company’s valuation, it does not guarantee accurate predictions about future earnings growth or stock prices. Therefore, investors should always consider multiple valuation metrics and other relevant factors when making investment decisions.
In conclusion, the price-to-earnings (P/E) ratio is an essential tool for evaluating a company’s stock valuation by comparing its current share price to its earnings per share. Studying historical trends in P/E ratios can provide valuable context and insights into market sentiment, growth prospects, and overall economic conditions. By examining the long-term fluctuations in the S&P 500 P/E ratio, investors can better understand how this metric is used to assess a company’s relative valuation against its industry peers and the broader market.

Advantages and Disadvantages of P/E Ratios
The price-to-earnings (P/E) ratio is a popular metric used by investors to evaluate a company’s stock value based on its earning potential. This valuation tool can provide essential insights into a company’s worth, helping you determine if the stock is undervalued or overvalued. However, like all financial indicators, P/E ratios come with their advantages and disadvantages.
Advantages of using P/E Ratios
- Earnings Expectations: A high P/E ratio could mean that investors are expecting significant earnings growth in the future. It can be an indicator that a company’s stock is undervalued, particularly if its earnings are projected to grow substantially.
- Easy Comparison: P/E ratios allow for easy comparison of companies within the same industry or across different timeframes. By looking at the P/E ratio, you can determine which stocks might be overvalued or undervalued compared to their peers.
- Historical Valuation: Long-term average P/E ratios for various industries provide insights into historical valuations and market trends. This information is valuable when evaluating a company’s current stock price in relation to its industry peers.
- Market Sentiment: A high P/E ratio may indicate that investors are optimistic about a company’s future prospects, while a low P/E ratio could suggest investor pessimism or uncertainty surrounding the company’s earnings potential.
Disadvantages of using P/E Ratios
- Limitations in Valuing Companies with No Earnings or Negative Earnings: P/E ratios cannot be calculated for companies without earnings, such as those in their early stages, or for companies that have reported losses. These companies need to be evaluated through other methods.
- Depends on Accurate Earnings Estimates: The accuracy of a P/E ratio depends on the reliability and consistency of earnings estimates. Inaccuracies can result in misleading information and incorrect stock valuations.
- Ignores Other Factors: The P/E ratio focuses only on earnings, leaving other essential factors such as a company’s debt levels, growth prospects, and overall financial health unconsidered. It is important to look at P/E ratios in conjunction with other financial indicators for a more comprehensive evaluation.
- Differences Between Industries: Comparing companies across different industries can be challenging due to varying industry-specific valuation multiples. For instance, some industries like technology or healthcare typically have higher P/E ratios than others, making direct comparisons less meaningful without considering the unique factors of each industry.
- Short-term Focus: The P/E ratio is based on trailing earnings and can be influenced by short-term events or market fluctuations that don’t necessarily reflect a company’s long-term value. To get a more accurate perspective, it’s essential to also consider forward P/E ratios, which use projected earnings instead of historical data.
In conclusion, the price-to-earnings (P/E) ratio is an important metric for evaluating a company’s stock worth based on its earning potential. However, it comes with advantages and disadvantages that investors must be aware of when using this tool in their investment decisions. Understanding these pros and cons can help you make more informed decisions and effectively use P/E ratios as part of your overall investment strategy.

Comparing Companies Using P/E Ratios
Understanding how to interpret and use price-to-earnings (P/E) ratios is essential for investors looking to compare companies’ valuations. By calculating a company’s P/E ratio, you can determine if its stock is overvalued or undervalued relative to its earnings per share (EPS). In this section, we will discuss techniques for comparing companies using P/E ratios.
Comparing against Industry Benchmarks
To compare two or more companies within an industry, it’s crucial to analyze their P/E ratios in relation to the industry average. An above-average P/E ratio signifies that a company might be considered overvalued, while a below-average P/E ratio could indicate undervaluation. For instance, if Company A has a P/E ratio of 20x, and its industry’s average is 15x, it may appear overpriced in comparison.
Comparing against Historical Data
It’s also essential to analyze a company’s historical P/E ratio trends to understand the stock’s valuation context. Comparing the current P/E ratio to past figures can help determine if the stock is experiencing unusual price swings or if it is following a general upward trend, indicating possible growth potential.
Forward vs. Trailing P/E Ratios
When comparing companies using P/E ratios, it’s crucial to consider both forward and trailing P/E ratios. Forward P/E ratios are based on analyst estimates of future earnings, while trailing P/E ratios use a company’s past 12-month EPS figures. Both approaches can provide valuable insights when evaluating the relative value of companies in various industries or sectors.
Advantages and Disadvantages
The use of P/E ratios for comparing companies has its advantages and disadvantages. One significant advantage is the ease with which it allows investors to compare companies across industries. However, a limitation of this valuation metric is that it doesn’t account for differences in growth rates or capital expenditures between companies, making direct comparisons challenging.
Comparing Growth Companies vs. Value Stocks
When comparing companies with differing growth rates or business models (e.g., value versus growth stocks), it’s essential to consider that a high P/E ratio for one company might be justified due to its growth potential, while a similar ratio for another could indicate overvaluation. In such cases, it’s important to investigate the reasons behind the companies’ differing P/E ratios before reaching any conclusions.
In conclusion, comparing companies using price-to-earnings (P/E) ratios is an essential skill for investors seeking to understand a stock’s valuation relative to its peers and historical data. By analyzing a company’s P/E ratio in comparison to industry benchmarks and historical trends, as well as considering both forward and trailing P/E metrics, you can make more informed investment decisions and gain a better understanding of the stock market landscape.
P/E Ratio and Market Sentiment
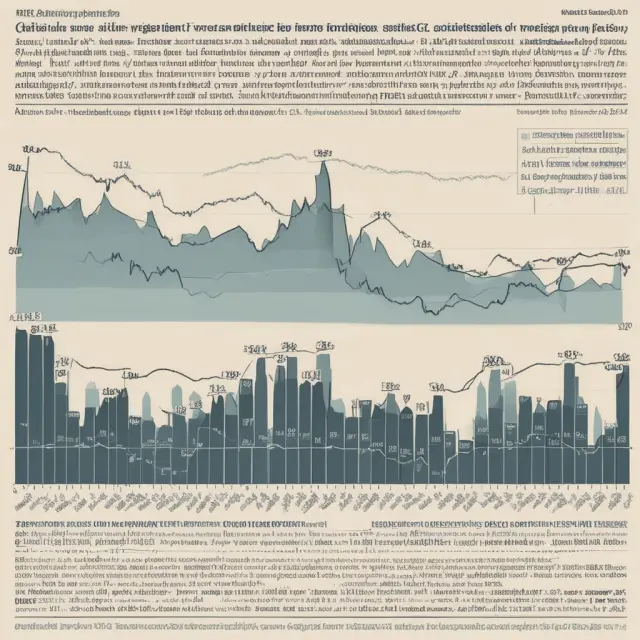
The relationship between investor sentiment and stock valuations can be effectively examined using the price-to-earnings (P/E) ratio. This financial metric measures a company’s current share price relative to its earnings per share (EPS), providing valuable insights into potential overvaluation or undervaluation of a stock. The P/E ratio not only helps investors determine if a company is appropriately valued, but it can also be used for industry comparisons or when analyzing market trends.
Understanding Market Sentiment and its Impact on Stock Valuations
Market sentiment refers to the overall attitude or feeling that investors hold toward a particular stock, sector, or the broader economy as a whole. This sentiment can significantly influence stock prices and valuations, with optimistic sentiment causing an increase in demand (and thus higher prices) for stocks, while pessimistic sentiment might lead to selling pressure (lowering stock prices).
The P/E Ratio as a Barometer of Market Sentiment
Given its emphasis on earnings, the P/E ratio can be a useful indicator of market sentiment. A high P/E ratio could suggest that investors expect strong future earnings growth or are willing to pay a premium for current earnings due to optimistic sentiments. Conversely, a low P/E ratio might indicate pessimism towards a company’s prospects or undervaluation, potentially signaling an opportunity for investors.
Comparing Companies and Industries
Comparing P/E ratios between companies within the same industry can provide valuable context when assessing market sentiment. For instance, if Company A has a significantly higher P/E ratio than Company B in the same industry, it may suggest that investors hold more optimistic views regarding the former’s future earnings growth potential. However, it is crucial to consider other factors as well, such as differences in business models or financial structures, before making definitive conclusions based on P/E ratios alone.
Understanding Historical Trends and Market Cycles
Historical trends in P/E ratios can also reveal patterns of market sentiment over time. For example, during periods of bull markets or economic expansions, higher P/E ratios are more common as investors exhibit greater optimism towards future earnings growth. In contrast, bear markets or recessions typically result in lower P/E ratios due to investor pessimism and a focus on current earnings rather than future growth potential.
Furthermore, analyzing the long-term trends of specific industries can help investors understand how sentiment has shifted over time and inform their investment decisions. For instance, the technology sector has historically seen higher P/E ratios due to its growth potential and the premium that investors are willing to pay for future earnings. In contrast, traditional industries like utilities or financial services may exhibit lower P/E ratios due to slower growth prospects and more stable cash flows.
In conclusion, the price-to-earnings ratio serves as a valuable tool in understanding market sentiment and stock valuations. By analyzing historical trends and comparing companies within the same industry, investors can gain insights into investors’ overall attitude towards particular stocks or sectors, potentially informing their investment decisions.

Special Considerations for Utilities, Real Estate, and Tech Companies
When evaluating P/E ratios, it’s essential to consider the unique characteristics of certain industries as they can significantly impact how these valuation metrics are interpreted. Three such industries include utilities, real estate, and technology companies.
Utilities:
Utilities generally have lower P/E ratios compared to other sectors due to their steady, predictable cash flow streams. These firms generate consistent revenue, making them less risky investments for investors. This stability makes it harder for utility stocks to appreciate in value, leading to lower P/E ratios. For example, the average P/E ratio for electric utilities is around 15x, whereas the S&P 500 has an average P/E ratio of about 16x.
Real Estate
The real estate industry presents a more complex situation when it comes to P/E ratios, as the standard EPS calculation does not apply directly. Real estate companies, like REITs (Real Estate Investment Trusts), earn their income primarily through rental properties and are required to distribute at least 90% of their taxable income to shareholders as dividends. Consequently, P/E ratios for real estate companies are typically replaced by price-to-book (P/B) or price-to-funds-from-operations (P/FFO) ratios.
Technology:
The technology sector is characterized by high growth rates and rapid innovation, making P/E ratios a less reliable indicator of value in this industry. As a result, investors often look at other metrics like revenue multiples or price-to-sales (P/S) ratios to assess the relative worth of tech companies. This is particularly true for emerging tech firms without significant profitability or earnings yet, which can still have substantial market capitalization.
In conclusion, P/E ratios are valuable tools for investors and analysts when it comes to determining a stock’s relative value. However, it’s essential to consider the unique features of specific industries such as utilities, real estate, or technology when interpreting these metrics. By understanding the nuances of each industry, you can make more informed investment decisions.

P/E Ratios and Earnings Growth
The price-to-earnings (P/E) ratio is an essential tool for investors to determine the valuation of a company’s stock based on its current share price in relation to its earnings per share (EPS). This section will delve deeper into understanding how P/E ratios can help investors analyze a company’s earnings growth potential.
When evaluating a company using P/E ratios, it is crucial to assess not only the ratio itself but also how that ratio compares against industry benchmarks and historical data. By analyzing a company’s P/E ratio alongside its earnings growth trends, investors can make informed decisions about whether the stock is overvalued or undervalued.
Earnings growth plays a pivotal role in determining the value of a company through its impact on P/E ratios. A higher earnings growth rate tends to result in a higher P/E ratio as investors are willing to pay more for future profits, while a lower earnings growth rate could indicate an undervalued stock.
For example, if two similar companies within the same industry have different P/E ratios but also distinct earnings growth rates, an investor can use this information to determine which company is a better investment opportunity. Companies with stronger earnings growth potential may warrant higher P/E ratios due to their future profitability outlook, while lower-growth companies could be considered undervalued with lower P/E ratios.
Investors should also consider the industry context when evaluating a company’s P/E ratio and earnings growth trends. Different industries may have varying average P/E ratios due to factors such as their level of risk, growth potential, and economic conditions. For instance, technology companies typically have higher P/E ratios than utilities or real estate firms due to their faster earnings growth rates and higher perceived growth potential.
By examining the historical trends in a company’s P/E ratio and earnings growth, investors can identify patterns that may indicate future stock performance. For instance, a declining P/E ratio accompanied by consistent earnings growth could be a sign of an undervalued stock, while a rising P/E ratio with stagnant or decreasing earnings could suggest an overvalued situation.
Investors can also use P/E ratios to identify potential catalysts that may impact a company’s earnings and share price. For example, if a company is expected to announce strong earnings growth in the near future, its P/E ratio might temporarily increase as investors bid up the stock price in anticipation of these improved earnings. Conversely, disappointing earnings reports or guidance could result in a declining P/E ratio and share price.
In summary, understanding the relationship between a company’s P/E ratio and earnings growth is crucial for investors looking to make informed investment decisions. By analyzing P/E ratios alongside historical trends and industry comparisons, investors can identify potential opportunities and risks in the stock market.

Frequently Asked Questions (FAQ)
What is a Price-to-Earnings (P/E) ratio?
The price-to-earnings ratio, commonly known as the P/E ratio, is a financial metric that measures the relationship between a company’s share price and its earnings per share (EPS). It provides valuable insights for investors and analysts to evaluate a stock’s relative value by comparing it against its industry peers or historical trends.
How is a P/E ratio calculated?
To calculate the P/E ratio, you divide the current market price of a single share by its earnings per share (EPS). Earnings per share can be obtained from either trailing 12 months (TTM) or projected forward data. The most common ratios are trailing and forward P/E, which differ based on their time horizons.
What does a high P/E ratio indicate?
A high P/E ratio might suggest that the stock price is overvalued relative to its earnings. However, it could also be an indicator of investors’ expectations for future growth. Companies with no or negative earnings do not have a P/E ratio, as there would be no EPS available in the denominator.
What are the advantages and disadvantages of using P/E ratios?
Advantages: P/E ratios help compare a company’s stock valuation against its industry peers or historical trends, providing valuable insights into overvalued or undervalued stocks. They also allow for easy comparison between companies with varying EPS figures due to size differences.
Disadvantages: P/E ratios can be misleading when comparing companies with vastly different growth rates or industries. Additionally, the methodology can sometimes be confusing, as there are both trailing and forward P/E ratios, each with its own strengths and limitations.
What is a good P/E ratio?
There’s no definitive answer to what constitutes a “good” P/E ratio, as it depends on the industry, company fundamentals, and economic conditions. Generally speaking, a lower P/E ratio might indicate an undervalued stock, while a higher P/E ratio could suggest overvaluation or growth potential.
What is the historical trend for P/E ratios?
The price-to-earnings ratio of the S&P 500 index has fluctuated significantly over time. Historical averages range from a low of around 5x to a high of over 120x, with the long-term average being roughly 16x. This measure is often used as a benchmark when evaluating a company’s relative valuation.
How do I compare companies using P/E ratios?
Comparing companies using their P/E ratios involves looking at their current ratios, historical trends, and industry averages. By analyzing these factors, investors can make informed decisions about which stocks offer better value for their investment dollars. Additionally, it’s important to consider the company’s growth prospects, competitive position, and financial health when making comparisons.
 Next entry · No. 4,057Understanding Price Leadership: How It Shapes Markets and Affects Investors
See also
-
 No. 1,364
05 Sep 2024
19 min
The Essential Guide to Understanding the EV/2P Ratio in Oil and Gas Valuations
Business Finance
No. 1,364
05 Sep 2024
19 min
The Essential Guide to Understanding the EV/2P Ratio in Oil and Gas Valuations
Business Finance -
 No. 1,303
27 Aug 2024
20 min
Understanding Earnings Per Share (EPS): Formula, Calculation, and Significance
Business Finance
No. 1,303
27 Aug 2024
20 min
Understanding Earnings Per Share (EPS): Formula, Calculation, and Significance
Business Finance -
 No. 5,416
07 Sep 2025
22 min
Understanding Value Stocks: Identifying and Investing in Undervalued Securities
Business Finance
No. 5,416
07 Sep 2025
22 min
Understanding Value Stocks: Identifying and Investing in Undervalued Securities
Business Finance -
 No. 5,405
06 Sep 2025
22 min
Understanding the Multifaceted Nature of Value in Finance and Investing
Business Finance
No. 5,405
06 Sep 2025
22 min
Understanding the Multifaceted Nature of Value in Finance and Investing
Business Finance -
 No. 5,394
05 Sep 2025
19 min
Valuation: Techniques and Methods for Determining the Intrinsic Value of a Company or Asset
Business Finance
No. 5,394
05 Sep 2025
19 min
Valuation: Techniques and Methods for Determining the Intrinsic Value of a Company or Asset
Business Finance -
 No. 5,003
04 Aug 2025
18 min
Understanding the Total Debt-to-Capitalization Ratio: Measuring a Company’s Leverage
Business Finance
No. 5,003
04 Aug 2025
18 min
Understanding the Total Debt-to-Capitalization Ratio: Measuring a Company’s Leverage
Business Finance