Understanding Head and Shoulders Pattern – A Reliable Indicator for Trend Reversals

Learn to recognize the Head and Shoulders pattern - a reliable indicator for trend reversals in stocks, commodities, and forex.
Introduction to the Head and Shoulders Pattern
A head and shoulders pattern is a widely used technical analysis indicator in financial markets that suggests a potential trend reversal from an uptrend to a downtrend. The pattern, which appears on a chart as three consecutive peaks, each with two troughs connecting them, consists of four distinct components: left shoulder, right shoulder, head, and neckline.
This section aims to shed light on what the Head and Shoulders Pattern is, its significance in identifying trend reversals, and how it differs from other chart patterns.
Description of the Head and Shoulders Pattern
The pattern gets its name from its shape that resembles a human head with two shoulders. The first peak, or the left shoulder, represents a normal bullish move in an uptrend market. The second peak, or the right shoulder, occurs when the price falls back to the support level but fails to surpass the previous high. The third and final peak, or the head, signifies the highest point of the trend before it begins its decline. The neckline is a horizontal line connecting the troughs (or peaks in case of an inverse pattern) between the left and right shoulders.
The Head and Shoulders Pattern serves as a bullish-to-bearish reversal indicator, implying that the trend will change from a rising one to a declining one once the neckline is breached. The significance of this pattern lies in its ability to signal an impending trend reversal, allowing traders to make informed decisions on entering or exiting trades.
Understanding the Significance of a Head and Shoulders Pattern
The appearance of a Head and Shoulders Pattern in a chart can be considered as a potential warning sign that a bullish uptrend has reached its peak and will soon reverse. A breakdown of the neckline can result in significant losses for investors if not managed correctly. The pattern is particularly useful when trading stocks, indices, or any other financial instrument where price trends are prevalent.
Traders often use various indicators like Moving Averages, Bollinger Bands, or Relative Strength Index (RSI) in conjunction with the Head and Shoulders Pattern for confirmation purposes. These indicators help validate the pattern’s reliability by providing additional evidence that a trend reversal is indeed imminent.
Investors also consider this chart pattern as one of the most reliable indicators due to its consistency and ability to predict potential price movements accurately. However, it is crucial to remember that no indicator guarantees 100% accuracy and should not be solely relied upon for making trading decisions without proper analysis and risk management strategies in place.
Stay tuned for the next section as we dive deeper into the components of a Head and Shoulders Pattern, discussing their roles and significance in the pattern’s formation.
Components of a Head and Shoulders Pattern
The Head and Shoulders pattern is an essential chart formation used in technical analysis to predict reversals from bullish to bearish trends. This pattern consists of four critical components, which we will discuss below.
1. The Head:
The head represents the middle peak in the pattern. It is the highest point among the three peaks and signals that the trend may be reaching its end. This peak appears when the price breaks above the previous high, forming a new resistance level. After this, prices pull back, creating a short-lived decline, only to experience another advance towards the neckline.
2. The Left Shoulder:
The left shoulder is the first peak in the pattern and acts as the baseline for measuring the potential height of the head and the subsequent right shoulder. This peak represents an uptrend reversal, where prices form a lower high compared to the upcoming head but still remain above the previous high, forming a bearish signal.
3. The Right Shoulder:
The right shoulder is the third peak in the pattern, which appears after the head and signifies the final peak before the downturn begins. This peak must retrace to a price level near the neckline and break below it, confirming the reversal trend.
4. The Neckline:
The neckline is a crucial part of the Head and Shoulders pattern, acting as the support or resistance line depending on the pattern direction. It connects the left and right shoulders and represents the potential trend continuation or reversal point. In an uptrend, it acts as resistance, while in a downtrend, it serves as support.
In summary, the Head and Shoulders pattern is composed of four components: the head, left shoulder, right shoulder, and neckline. These features create a specific chart formation that signals the end of a bullish trend and an impending bearish one. Understanding these elements enables traders to recognize this powerful reversal indicator in their charts and capitalize on potential market shifts.
Remember, this is just a single section. For the full article, please refer to the original outline provided above.

Identifying a Bullish Head and Shoulders Pattern
The Head and Shoulders pattern is an essential chart formation in technical analysis used to predict a bullish-to-bearish trend reversal. This reliable indicator forms when a stock’s price experiences three distinct peaks, with the middle peak (head) being significantly higher than the other two (shoulders). The neckline plays a crucial role in validating this pattern; it acts as support during an uptrend and resistance during a downtrend.
To identify a bullish Head and Shoulders pattern, follow these steps:
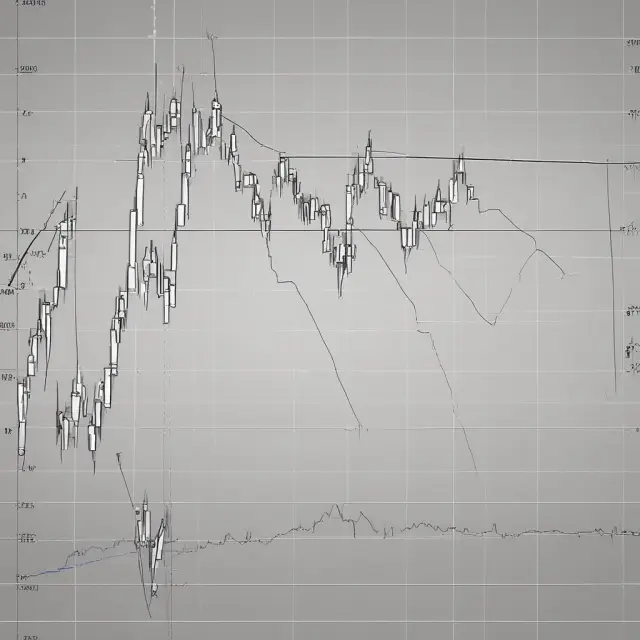
1. Look for three peaks forming a reverse triangle with the middle peak (head) being substantially higher than the outer two peaks (shoulders). This formation signals the potential reversal of an uptrend.
2. Determine the neckline that connects the left and right shoulders. This line acts as support during the pattern’s development. When prices touch or bounce off this line, it can indicate a bullish reversal.
3. Monitor price behavior near the neckline to confirm the trend reversal. If prices begin to consolidate around the neckline or break above it, it’s a strong indication that an uptrend is in progress and the bearish phase has ended.
For example, let’s consider an imaginary stock ‘XYZ’, which has been experiencing a bullish trend over several months. As prices approach resistance levels, the stock experiences pullbacks followed by recoveries. However, as prices approach the neckline during these pullbacks, they fail to rebound strongly, indicating potential weakness in the uptrend.
- The first peak (left shoulder) is formed at point A with a price of $50.
- The second peak (head) is formed at point B with a higher price of $60.
- The third peak (right shoulder) is formed at point C with a lower price than the head but still above the neckline, indicating support.
- Prices touch and bounce off the neckline several times during subsequent pullbacks, as shown in points D1, D2, and D3. This weakened response to the neckline could indicate the start of a trend reversal.
- Finally, the trend is confirmed when prices break above the neckline (point E), signaling the beginning of an uptrend.
By carefully monitoring price movements and understanding this chart pattern, traders can utilize the Head and Shoulders indicator to identify potential bullish-to-bearish trend reversals in their investments.
Identifying an Inverse (Bearish) Head and Shoulders Pattern
A bearish head and shoulders pattern is the opposite of its bullish counterpart, signaling a downtrend reversal. This pattern can be easily recognized by its unique three troughs formation. The inverse head and shoulders pattern emerges when a stock or security experiences consecutive lows that are separated by brief recoveries.
The first trough forms the left shoulder, while the second trough, which is typically lower than the previous one, represents the head. The final trough creates the right shoulder. Once the third trough is reached, prices start moving upward toward the resistance, known as the neckline—which rests near the top of the two previous troughs or just below the second trough’s peak.
An inverse head and shoulders pattern provides valuable insights for traders, particularly those looking to capitalize on downtrend reversals. When prices break through the neckline resistance, it is a strong indicator that a bullish trend is underway. This reversal is often accompanied by significant buying interest in the market, leading to price increases.
To effectively use an inverse head and shoulders pattern for trading, traders must first identify this chart formation on their charts. The following steps can help you recognize an inverse head and shoulders pattern:
- Identify the left shoulder trough, which forms the baseline of the pattern. This is typically the lowest point in the price action before a series of lower lows.
- Look for the second trough, which is the head, forming a lower low than the left shoulder. The head often causes a period of increased selling pressure, leading traders to believe that the downtrend is still intact.
- Locate the right shoulder trough, which forms the final trough in the pattern. This trough should be higher than the previous two troughs and indicate a period of consolidation before the reversal.
- Determine the neckline, which represents the level at which buyers are entering the market and starting to push prices upward. The neckline is drawn by connecting the left shoulder and head troughs or just below the peak between them.
- Monitor price action as it approaches the neckline resistance. Once prices break above the neckline, it signifies that the bearish trend has reversed, and a new uptrend is starting.
When applying an inverse head and shoulders pattern for trading purposes, it’s essential to understand its potential advantages and disadvantages:
Advantages:
– A reliable indicator of downtrend reversals
– Provides clear profit targets based on the distance between the neckline and head
– Can be used in all markets, including forex and stocks
– Offers an opportunity for significant gains when prices break above the neckline
Disadvantages:
– Requires patience as it takes time to form a complete pattern
– Limited predictive power—it is not always accurate and may lead to false signals
– Prone to noise or interference from external market factors
In conclusion, an inverse head and shoulders pattern is a valuable chart formation that traders use to identify downtrend reversals. By recognizing this pattern’s components and understanding its implications, investors can capitalize on price movements and profit from shifting trends in the financial markets.
Understanding the Significance of a Head and Shoulders Pattern
A head and shoulders pattern is an essential indicator for traders seeking to predict a bullish-to-bearish trend reversal. This reliable chart formation is characterized by three peaks, where the outer two are close in height, and the middle peak (called the ‘head’) is higher than the other two. The significance of a head and shoulders pattern lies in its ability to signal that a prolonged upward trend may be coming to an end.
The pattern starts with the first peak (left shoulder), which marks the beginning of the upswing. After reaching this initial high, the stock’s price declines back towards its base, forming the left trough or ‘shoulder’. The second rise in price leads to the formation of a higher peak (right shoulder) than the previous one. This peak is often accompanied by increased buying activity from investors, further pushing the price upwards. However, the stock eventually fails to maintain this momentum and declines back to the base—forming the third trough or ‘shoulder’—near the level of the left shoulder.
The line connecting the first and second troughs is called the neckline. The significance of the neckline lies in its role as a potential support level for an uptrend and resistance for a downtrend. As long as the price remains above this line, the bullish trend continues; however, once it breaks below, bearish traders may consider entering short positions, expecting a reversal.
An inverse head and shoulders pattern—a bullish-to-bearish trend reversal—is characterized by three consecutive lows, separated by temporary rallies. The second trough is the lowest (the ‘head’) while the first and third are shallower (the ‘shoulders’). This pattern indicates that a downtrend is nearing its end and may soon be replaced by an uptrend. When prices decline to the final trough, they start rallying towards the resistance level found near the top of the previous troughs, which can serve as the entry point for long positions.
In summary, understanding the significance of a head and shoulders pattern is crucial for traders who want to predict trend reversals in their investments. By recognizing this chart formation, investors can potentially enter the market at optimal entry points and exit when appropriate, thereby maximizing profits and minimizing losses.

Advantages and Disadvantages of Using the Head and Shoulders Pattern
The head and shoulders pattern is an essential technical indicator for traders seeking to predict potential market reversals. Its unique chart formation, which consists of three distinct peaks, provides valuable information about a stock’s price movement. In this section, we will discuss the advantages and disadvantages of employing this popular strategy in your trading activities.
Advantages:
- **Easily Identifiable**: Experienced traders can quickly spot a head and shoulders pattern due to its distinctive shape. The pattern’s clear definition makes it an attractive choice for those looking for reliable trend reversal indicators.
- **Defined Profit and Risk**: The head and shoulders pattern provides well-defined entry points and stop loss levels, enabling traders to set their targets and limits with greater precision. This clarity can help minimize potential losses while optimizing profits.
- **Applicable across Markets**: This versatile indicator is suitable for various markets, including stocks and forex. Its ability to identify trend reversals in different asset classes adds significant value to traders’ toolboxes.
- **Big Market Movements**: The head and shoulders pattern can generate substantial price swings within a reasonable timeframe. Traders who enter at the right moment can profit significantly from these market movements.
Disadvantages:
- **Novice Traders May Miss It**: New traders might find it challenging to spot the head and shoulders pattern, especially if it doesn’t present with a flat neckline. The skewed nature of this pattern may confuse those unfamiliar with its appearance.
- **Large Stop Loss Distances**: Given that the head and shoulders pattern requires significant price movements for confirmation, stop loss distances can be extensive, exposing traders to larger potential losses if the market moves against their position.
- **Unfavorable Risk-to-Reward**: The reward-to-risk ratio in this strategy may not always be favorable. Traders need to carefully consider the potential gains and losses before engaging in a trade based on this indicator.
- **Neckline Can Appear to Move**: If the price pulls back, the neckline might be retested, potentially leading to confusion among traders. This occurrence could result in missed opportunities or unnecessary anxiety about their positions.
In conclusion, the head and shoulders pattern offers several advantages for traders seeking to capitalize on potential trend reversals. However, it also comes with certain disadvantages that should be taken into account when employing this strategy. By understanding both the pros and cons of the head and shoulders pattern, traders can make informed decisions about its application in their trading activities.

How to Trade a Head and Shoulders Pattern?
The head and shoulders pattern is a popular chart formation among traders aiming to identify potential trend reversals in securities. This section will delve into the intricacies of entering and exiting trades based on this indicator, along with crucial considerations such as stop losses.
Entering Trades
To enter a long position when using the head and shoulders pattern, it is essential to identify the trend reversal. Generally, you would want to wait for the price to break below the neckline, which serves as resistance in an uptrend. Once the stock falls below this line, it may indicate that a bearish trend is beginning or at least taking a breather.
To maximize profit potential, consider using a trailing stop loss order once you enter the market. This order type allows your profit target to move with the price and automatically adjusts based on the market conditions. In a downward trend, for example, a trailing stop loss might be set at a percentage below your entry price (e.g., 5%). If the stock starts moving in an upward direction again and rises above the neckline, this stop loss would automatically exit your trade to lock in profits.
Exiting Trades
To close a long position when using the head and shoulders pattern, consider exiting once the price breaks above the right shoulder. This move indicates that the reversal may have ended, or at least, that the downtrend is taking a pause. Depending on your overall trading strategy and risk tolerance, you may choose to take profits at this point or trail your stop loss higher as the price rises to secure potential gains.
On the other hand, if the stock fails to break above the right shoulder, it might suggest that further declines are imminent. In such a case, you could consider holding onto the position or adjusting your stop loss lower to protect your investment. Remember that no chart pattern is foolproof, and market conditions can change quickly. Always monitor your positions closely and be prepared for volatility.
Stop Losses
Lastly, it’s essential to understand that a head and shoulders pattern is not guaranteed to generate profits every time. As mentioned earlier, the reliability of this indicator lies within its ability to provide entry and exit points based on historical price movements. However, stop losses can help minimize potential losses by limiting your risk exposure.
A common approach for implementing stop losses with the head and shoulders pattern involves setting a stop loss below (for long positions) or above (for short positions) the most recent swing low (high) before the formation of the pattern. This level might not be the exact point where price action reverses, but it represents a reasonable estimate based on recent market behavior.
Additionally, when using trailing stop losses, as previously mentioned, ensure that you set an appropriate percentage or fixed dollar value for your trailing stop loss, depending on your risk tolerance and trading objectives. A well-placed stop loss can help protect your investment while enabling the potential for profits if the trend reverses as anticipated.
In conclusion, the head and shoulders pattern offers valuable insights into potential trend reversals for traders. By understanding how to enter and exit trades effectively using this indicator and applying appropriate stop losses, you may be able to capitalize on market movements more confidently. Keep in mind that no strategy is foolproof, so always practice careful risk management and stay informed about the latest market conditions.

Reliability of the Head and Shoulders Pattern
The head and shoulders pattern is renowned among traders for its accuracy in predicting trend reversals. The consistency of this chart formation makes it a go-to indicator for many investors looking to capitalize on market shifts. However, the reliability of the head and shoulders pattern can sometimes be a subject of debate. In this section, we will discuss the accuracy and efficiency of using this strategy.
To begin with, it’s important to note that no technical analysis tool is foolproof; all indicators come with their inherent limitations. The head and shoulders pattern is no exception. But despite its imperfections, traders believe it to be one of the most reliable trend reversal patterns. In a bullish head and shoulders scenario, the first peak represents an early sign that the uptrend may be losing momentum. As the stock price continues to climb, a second, significantly higher peak emerges, followed by a decline back to the support level near the base of the initial upswing. The third peak is often called the “head,” and it’s this formation that signals a potential reversal—a bearish trend may be on its way.
The inverse head and shoulders pattern follows similar logic in a downtrend, with three troughs instead of peaks. Here, the first low is followed by a second, lower trough, which eventually gives way to a recovery leading to the third shallow trough. Once the final trough is made, an upward trend may begin, as bullish traders enter the market in anticipation of further gains.
The neckline plays a crucial role in both bullish and inverse head and shoulders patterns. In the bullish version, it acts as resistance, while in the inverse variant, it serves as support. The neckline is determined by connecting the troughs or peaks, depending on the direction of the pattern. Traders closely monitor this line to identify potential entry points, setting their stop losses accordingly.
The reliability of the head and shoulders pattern can be influenced by several factors, including market volatility and timing. Market movements are inherently unpredictable, and even the most seasoned traders may find themselves on the wrong side of a reversal. Moreover, it’s essential to identify a confirmed trend reversal, as opposed to a false signal. Some traders use moving averages or other indicators in conjunction with head and shoulders patterns to help mitigate risk.
A significant advantage of the head and shoulders pattern is its versatility across various markets and timeframes. It can be used effectively in forex, stock trading, and other financial instruments, making it a valuable tool for investors seeking to capitalize on broader trends. However, this same flexibility can also pose challenges, as identifying a valid head and shoulders pattern requires a solid understanding of market dynamics and price action.
Traders also need to be aware that the head and shoulders pattern is just one component of their overall analysis strategy. No single indicator should dictate all trading decisions, and it’s crucial to consider multiple factors before making an investment commitment. Furthermore, understanding the significance of different patterns, such as double tops and bottoms or triangles, can help traders make more informed decisions when applying technical analysis.
In conclusion, the head and shoulders pattern is a reliable indicator for trend reversals, providing valuable insights into potential shifts in market direction. Despite its imperfections, this chart formation offers numerous advantages to investors seeking to capitalize on bullish-to-bearish or bearish-to-bullish transitions. By combining it with other analysis tools and employing proper risk management techniques, traders can maximize the potential benefits of using this powerful technical indicator.

Famous Examples of Head and Shoulders Reversals
The head and shoulders pattern is widely regarded as a reliable indicator for predicting trend reversals in financial markets. Numerous investors and traders have successfully utilized this chart pattern to capitalize on significant market movements. Here, we present some prominent examples that illustrate the application of the head and shoulders reversal pattern.
1. IBM (International Business Machines Corporation) – 1982
One of the most famous instances of a head and shoulders reversal occurred in IBM’s stock price during 1982. After an extended bullish trend, the technology giant saw its share prices peak in March, forming the “head” of the pattern (Figure A). The subsequent decline marked the formation of the first shoulder in April. However, the stock rebounded briefly, only to drop once more and form the second shoulder in May. Finally, IBM’s stocks bottomed out in September, creating a clear neckline for this bullish-to-bearish reversal (Figure B).
2. Microsoft Corporation – 1999
Another notable example can be traced back to Microsoft during late 1999. The software giant had experienced an impressive run-up in its stock price, peaking at $64.85 in December 1999 (Figure C). This marked the formation of the “head” of the pattern. The subsequent decline created the first shoulder in January 2000, while a brief recovery led to the second shoulder in March 2000. Finally, Microsoft’s stock price plummeted below $35, establishing a clear neckline and signaling a significant downtrend (Figure D).
3. Apple Inc. – 2015
More recently, in early 2015, Apple experienced a bullish-to-bearish reversal as its stock prices formed a head and shoulders pattern. The first peak occurred in November 2014 at around $119.75 (Figure E), followed by a decline that created the left shoulder in January 2015. A short-lived recovery led to the formation of the right shoulder in March 2015, and finally, Apple’s stock prices dropped below the neckline in August 2015 (Figure F).
These examples demonstrate the significance of a head and shoulders pattern in identifying trend reversals. By understanding this chart pattern, investors can potentially capitalize on significant market movements to secure substantial profits or minimize losses.

FAQs about the Head and Shoulders Pattern
Understanding the Head and Shoulders pattern frequently raises questions among traders and investors. In this section, we’ll address some common inquiries regarding this popular technical analysis tool.
What is a Head and Shoulders Pattern?
A head and shoulders pattern is a chart formation used to predict a bullish-to-bearish trend reversal. The pattern consists of three peaks, where the outer two are close in height and the middle peak (the ‘head’) is the highest. A neckline drawn through the troughs or peaks (in an inverse pattern) separates the formation from the general market trend.
Can a Head and Shoulders Pattern signal a Bullish Reversal?
Yes, although it’s more commonly associated with bearish reversals, an inverse head and shoulders pattern signals a bullish-to-bullish trend reversal. In this case, the stock price reaches three consecutive lows separated by temporary rallies, forming the shoulders and the head, with the final rally signaling the reversal.
What are the Components of a Head and Shoulders Pattern?
A head and shoulders pattern has four main components: the first peak (left shoulder), the second peak (head), the third peak (right shoulder), and the neckline connecting them. The neckline acts as resistance or support depending on the overall trend direction.
How does a Neckline Impact a Head and Shoulders Pattern?
The neckline, drawn through the troughs or peaks in an inverse pattern, serves as crucial resistance or support for the stock price. A bullish reversal occurs when the stock price breaks above the neckline, while a bearish reversal is indicated when it falls below the neckline.
What are the Advantages and Disadvantages of Using a Head and Shoulders Pattern?
Advantages:
– The pattern can be easily identified by experienced traders.
– It offers a defined risk/reward scenario with clear entry, exit points, and stop loss levels.
– Large market movements can be profited from.
– Can be used in all markets.
Disadvantages:
– Novice traders may find it challenging to identify the pattern accurately.
– The neckline might appear to move as the price fluctuates, causing confusion for some traders.
– The stop loss distances can be significant due to the long timeframes involved.
– Unfavorable risk-to-reward ratios may discourage some traders.
Is a Head and Shoulders Pattern Always Accurate?
No, while the head and shoulders pattern is considered a reliable trend reversal indicator, it doesn’t guarantee 100% accuracy. Traders should always use this tool in conjunction with other indicators and confirmation signals to make informed decisions.
 Next entry · No. 2,053Understanding the Role and Responsibilities of a Head Trader in Finance and Investments
See also
-
 No. 541
29 Apr 2024
20 min
Understanding and Utilizing the Bullish Engulfing Pattern in Stock Trading
Markets
No. 541
29 Apr 2024
20 min
Understanding and Utilizing the Bullish Engulfing Pattern in Stock Trading
Markets -
 No. 1,135
02 Aug 2024
19 min
Understanding the Dragonfly Doji Candlestick Pattern: What It Is and How to Use It
Markets
No. 1,135
02 Aug 2024
19 min
Understanding the Dragonfly Doji Candlestick Pattern: What It Is and How to Use It
Markets -
 No. 4,824
19 Jul 2025
23 min
Swing Trading: Understanding This Style of Active Investment
Investments
No. 4,824
19 Jul 2025
23 min
Swing Trading: Understanding This Style of Active Investment
Investments -
 No. 594
01 May 2024
18 min
Understanding Candlesticks: The Essential Tool for Technical Analysis in Finance and Investment
Financial Tools
No. 594
01 May 2024
18 min
Understanding Candlesticks: The Essential Tool for Technical Analysis in Finance and Investment
Financial Tools -
 No. 885
25 Jun 2024
17 min
Understanding Dead Cat Bounces: Recognizing This Short-Lived Market Rally
Markets
No. 885
25 Jun 2024
17 min
Understanding Dead Cat Bounces: Recognizing This Short-Lived Market Rally
Markets -
 No. 4,688
08 Jul 2025
21 min
Understanding the Power of Social Media for Institutional Investors
Business Strategy
No. 4,688
08 Jul 2025
21 min
Understanding the Power of Social Media for Institutional Investors
Business Strategy