Understanding Money Flow: Calculation, Indicators, and Significance for Traders

Money flow is a technical indicator equal to a period's typical price, the average of its high, low and close, multiplied by trading volume. It counts as positive when the typical price rose from the prior period and negative when it fell, and the two totals feed the Money Flow Index.
Correction: This entry's money flow formula omits dividing by 3: money flow is the typical price, (high + low + close) / 3, times volume. Its Day Two is positive money flow, not negative, because the typical price rose from 62.67 to 63.00.
What is Money Flow?
Money flow, a powerful tool for traders, represents the amount of capital flowing into or out of an asset over a specific period. It can help predict potential price trends by analyzing the relationship between price and volume in trading activities. Unlike simple volume analysis, money flow takes both direction (upticks and downticks) and magnitude (size of trades) into account.
To calculate money flow, traders begin by determining their high, low, and closing prices for each day. They then multiply these values by the daily trading volume:
Money Flow = [(High Price + Low Price + Closing Price) x Volume]
Comparing the money flow figure from one day to the next provides essential information about the overall trend of an asset. When a stock experiences positive money flow, its price is generally increasing, and there have been more upticks (buying activity) than downticks (selling activity. Conversely, if there are more downticks than upticks, the money flow will be negative, signaling that the price could be poised to decrease.
Consider an example where day one has a high of $65, low of $60, close of $63, and daily volume of 500,000 shares:
Money Flow (Day One) = ($65 + $60 + $63) x 500,000 = $31,333,333
On the second day, the high is $66, low is $58, close remains at $65, and daily volume falls to 300,000 shares:
Money Flow (Day Two) = ($66 + $58 + $65) x 300,000 = $18,900,000
Negative money flow between Day One and Day Two indicates that fewer investors were willing to pay the higher price on Day Two, potentially foreshadowing a reversal in the upward trend.
Money flow is a valuable tool for traders as it provides insights into the behavior of both buyers and sellers in the market. Its significance extends beyond volume analysis, helping investors to identify potential buying or selling opportunities and predict future price trends.

Understanding Positive and Negative Money Flow
Money flow is a critical concept for traders as it offers insight into the direction of price movements based on buying and selling activities, as opposed to simply relying on volume data. The calculation and interpretation of money flow involves understanding positive and negative money flow.
Positive Money Flow: A day with positive money flow signifies that more buyers have paid a higher price (uptick) than sellers who sold at lower prices (downticks). This circumstance implies a strong demand for the stock, potentially leading to further price appreciation. For instance, consider Day One in our example below, which shows positive money flow:
Day One
High: $65
Low: $60
Close: $63
Daily volume: 500,000 shares
Money Flow calculation: ($65 * 500,000 + $60 * 500,000 + $63 * 500,000) / 500,000 = $31,333,333
Negative Money Flow: Conversely, negative money flow occurs when more sellers sell stocks at a lower price (downtick) than buyers who purchase at higher prices (upticks). This circumstance suggests weak demand and may indicate that prices are poised for a decline. Day Two below is an example of negative money flow:
Day Two
High: $66
Low: $58
Close: $65
Daily volume: 300,000 shares
Money Flow calculation: ($66 * 300,000 + $58 * 300,000 + $65 * 300,000) / 300,000 = $18,900,000
Traders monitor money flow to anticipate potential price reversals and trends. A sudden shift in money flow can signal a change in market sentiment and help identify potential trading opportunities. For instance, negative money flow in an uptrend could indicate a pending reversal. Traders may utilize various money flow indicators like the Chaikin Money Flow Oscillator and Money Flow Index (MFI) for more efficient analysis of these trends.
In conclusion, understanding positive and negative money flow is essential for traders as it offers valuable insights into buying and selling activities that can inform trading decisions and improve overall market awareness.

Importance of Money Flow for Traders
Money flow is a significant factor that traders closely monitor to evaluate market trends, identify potential entry points, and make informed decisions. By analyzing the buying and selling pressures in the market, money flow offers valuable insights into the flow of capital and the direction of future price movements.
In simple terms, positive money flow occurs when investors purchase stocks at higher prices (an uptick), while negative money flow happens when they acquire shares at lower prices (a downtick). Understanding these trends allows traders to recognize early signs of potential reversals or continuation of existing market trends.
For instance, if a stock is experiencing negative money flow during an uptrend, it might indicate that the trend could be reversing soon. This information can help traders adjust their strategies accordingly to maximize profits and minimize losses.
Investors primarily use money flow as a leading indicator, as trading volume is generally considered to precede price movements. By monitoring the trends in money flow, traders can potentially identify early buying or selling opportunities and make decisions before significant price changes occur.
Money Flow Indicators: Chaikin Money Flow Oscillator and Money Flow Index (MFI)
Two popular indicators for analyzing money flow are the Chaikin money flow oscillator and money flow index (MFI). These tools provide valuable insights by quantifying the buying and selling pressures in a particular security.
The Chaikin money flow oscillator, developed by Marc Chaikin, is particularly useful as it combines both volume and price data into a single indicator. The indicator uses two exponential moving averages to determine momentum, making it an effective tool for identifying potential trend reversals or continuations.
On the other hand, the money flow index (MFI) is another widely used indicator that divides net positive money flow by net negative money flow and plots the result as a single line. By analyzing this line against the price of a security, traders can easily identify overbought or oversold conditions. Traders often employ these indicators in conjunction with others to increase their effectiveness and reduce false trading signals.
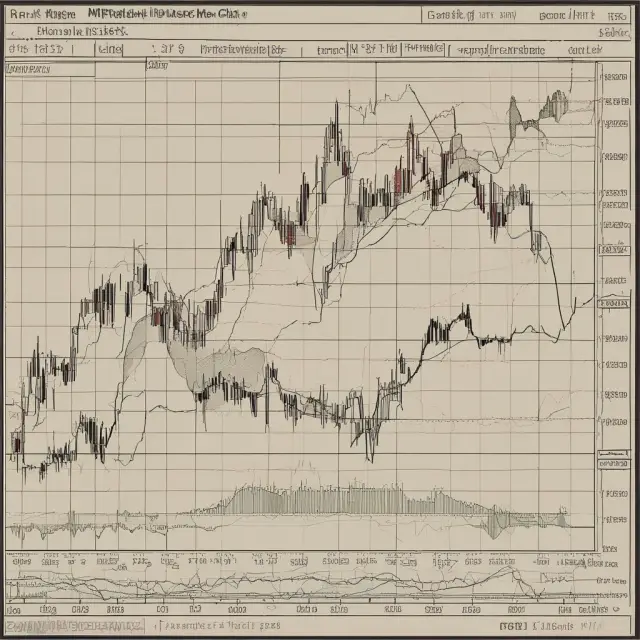
Money Flow Indicators: Chaikin Money Flow Oscillator and Money Flow Index (MFI)
Two widely used tools for analyzing money flow are the Chaikin Money Flow Oscillator and the Money Flow Index (MFI). These indicators help traders evaluate buying and selling pressure, price movements, and potential market trends.
The Chaikin Money Flow Oscillator, developed by Marc Chaikin, calculates the difference between money flow and moving averages, which provides insights into momentum. Money flow is calculated as follows: multiply daily volume by the difference between the closing price and the lowest price (uptick) or highest price (downtick), sum these values for all trading days, then divide by total shares traded in the period.
For instance, let’s compare Day One and Day Two:
Day One: High: $65, Low: $60, Close: $63; Daily Volume: 500,000 Shares
Money Flow Calculation for Day One: ($63-$60)×500,000 = $10,000,000
Day Two: High: $66, Low: $58, Close: $65; Daily Volume: 300,000 Shares
Money Flow Calculation for Day Two: ($65-$58)×300,000 = $4,250,000
Total Money Flow for the Period: $14,250,000 (Sum of the two money flow amounts)
The Chaikin Money Flow Oscillator then calculates the percentage of money flowing in and out of a security by dividing the difference between the current period’s money flow and the moving average money flow by the total money flow. This value oscillates around zero, with positive values indicating buying pressure and negative values signaling selling pressure.
The Money Flow Index (MFI), created by Gary J. Arms, is another popular indicator that divides net positive money flow by net negative money flow to generate a single line chart. This ratio can help determine overbought or oversold conditions. The MFI value ranges between 0 and 100. A reading above 80 indicates overbought conditions, while a reading below 20 implies oversold conditions.
To use the Chaikin Money Flow Oscillator and MFI effectively, consider combining them with other technical indicators to minimize false trading signals and ensure accurate interpretations of market trends.

Interpreting Money Flow Data
Understanding how to interpret money flow data is crucial for making informed trading decisions. Money flow can help identify buying and selling pressure, price trends, and potential reversals. To analyze money flow data effectively, let’s dive deeper into understanding the relationship between positive and negative money flow and their significance.
Positive Money Flow
Positive money flow occurs when buyers are willing to purchase a security at a higher price than the previous trade (an uptick). This indicates that there is significant demand for the stock. Positive money flow can indicate the following:
- Uptrend confirmation: When positive money flow consistently appears during an upward trend, it reinforces the trend’s direction and suggests continued buying interest.
- Bullish reversal signal: During a downtrend, if a security experiences a day of positive money flow, it may indicate a potential bullish reversal.
- Strengthening support levels: When prices are falling but there is positive money flow, it can potentially strengthen the support level at the current price.
Negative Money Flow
Negative money flow occurs when buyers purchase shares at a lower price than the previous trade (a downtick). This indicates that there is selling pressure and bears are exiting or shorting the security. Negative money flow may suggest:
- Downtrend confirmation: When negative money flow consistently appears during a downtrend, it reinforces the trend’s direction and suggests continued selling interest.
- Bearish reversal signal: During an uptrend, if a security experiences a day of negative money flow, it may indicate a potential bearish reversal.
- Weakening resistance levels: When prices are rising but there is negative money flow, it can potentially weaken the resistance level at the current price.
Comparing Money Flow to Volume
Money flow and volume are closely related, as trading volume indicates the number of shares traded during a specific time frame. However, it’s important to note that money flow goes beyond simple volume calculations by taking into account the directional change in prices as well. Understanding both metrics is crucial for traders as they can provide different insights to help make informed decisions.
Analyzing Money Flow Data with Indicators
Two popular indicators used for analyzing money flow data are the Chaikin money flow oscillator and the money flow index (MFI). These tools can help traders better understand buying and selling pressures, price trends, and potential reversals within a security. Incorporating these indicators into your trading strategy can improve your overall analysis and reduce false signals.
The Chaikin money flow oscillator is particularly useful as it not only displays the net money flow but also incorporates moving averages to identify momentum. This indicator’s unique approach to displaying buying and selling pressures can help traders make more informed decisions, especially during volatile market conditions.
Similarly, the money flow index (MFI) provides valuable insights into a security’s strength by dividing net positive money flow by net negative money flow. MFI values above 80 indicate overbought conditions while values below 20 suggest oversold conditions. By comparing these values to price levels, traders can identify potential entry and exit points for their positions.
In conclusion, understanding how to interpret money flow data is essential for traders as it provides insights into buying and selling pressures, trend direction, and potential reversals within a security. By utilizing popular indicators like the Chaikin money flow oscillator and MFI, traders can gain an edge in their analysis and make more informed trading decisions.

Money Flow’s Limitations and False Signals
Money flow analysis is a powerful tool for understanding buying and selling pressure within the financial markets, but it isn’t infallible. Understanding money flow’s limitations and false signals can help investors make more informed decisions when using this valuable indicator.
First, it is essential to understand that money flow doesn’t account for changes in share price due to factors outside of buying and selling pressure. For instance, a stock might experience an increase in volume due to news announcements or earnings reports, which could skew the money flow results without indicating real buying or selling pressure. In such cases, investors should consider additional context when interpreting money flow data.
Another limitation is that money flow doesn’t account for price changes due to short-selling or leveraged positions. For example, a significant decrease in money flow while the stock price rises may not represent bearish sentiment but could instead indicate large short positions being opened or increased. This situation highlights the importance of considering other indicators and market conditions when analyzing money flow data.
False signals can also arise from certain market structures. For instance, during a trending market, high levels of buying pressure might result in positive money flow even though the stock price continues to fall due to strong bearish sentiment. In this situation, it is crucial for investors to consider other factors such as moving averages or Fibonacci retracement levels when assessing the overall trend direction.
To maximize the effectiveness of money flow analysis, traders should combine it with other indicators and technical tools. For example, pairing the Chaikin money flow oscillator and the moving average convergence divergence (MACD) indicator can help confirm potential buy or sell signals. Additionally, understanding different market conditions like consolidation periods or trending markets is crucial when interpreting money flow data to minimize false signals and make more accurate trading decisions.
Advanced Money Flow Analysis Techniques
As traders delve deeper into money flow analysis, they often employ advanced techniques to gain a competitive edge. Two popular methods include the Chaikin Money Flow Oscillator and the Money Flow Index (MFI). These indicators provide additional insights by incorporating momentum and price direction into money flow calculations.
Chaikin Money Flow Oscillator: Marc Chaikin’s creation, the Chaikin Money Flow Oscillator (CMF), generates values for buying and selling pressure much like other money flow indicators. However, it adds two exponential moving averages to determine momentum in a manner similar to the Moving Average Convergence Divergence (MACD) indicator. The CMF line oscillates around a zero-line, with values above zero indicating positive money flow and below zero representing negative money flow. When the line crosses above or below the zero-line, it can generate buy or sell signals, respectively. Traders may use multiple timeframes to determine trends, entry points, or potential reversals.
Money Flow Index (MFI): The Money Flow Index (MFI) is another advanced money flow indicator that divides net positive money flow by the net negative money flow, producing a value ranging from zero to 100. When the MFI line exceeds 80, it suggests overbought conditions, while a reading below 20 indicates oversold prices. The MFI is especially useful when comparing it with a security’s price chart to identify divergences and potential buy or sell opportunities. For instance, if the MFI reads significantly lower than the stock’s price during an uptrend, this could be a bearish signal that a reversal may occur soon.
Other technical indicators should not be overlooked when using money flow indicators to make informed decisions. Combining these tools can help improve accuracy and reduce false trading signals. By utilizing multiple timeframes and understanding the nuances of each indicator, traders can adapt their strategies to market conditions and capitalize on various opportunities.

Maximizing the Effectiveness of Money Flow Analysis
Money flow analysis is a powerful tool for understanding market trends and making informed investment decisions, but it’s essential to use it effectively. Here are several recommendations for enhancing your money flow analysis skills.
1. Combine Money Flow with Other Indicators: While money flow is an excellent standalone indicator, combining it with other technical indicators can significantly improve its effectiveness and reduce false signals. For instance, pairing money flow with moving averages or Bollinger Bands helps traders better identify trends and trend reversals.
2. Use Multiple Timeframes: Analyzing money flow across various time frames enables traders to capture both short-term and long-term opportunities. For instance, short-term traders can use intraday charts, while long-term investors may prefer daily or weekly charts.
3. Set Custom Thresholds: Default thresholds for overbought (80) and oversold (20) conditions do not always apply to every security or market condition. Setting custom thresholds based on historical data can help traders identify optimal entry and exit points.
4. Consider Market Sentiment: Market sentiment is an essential factor in any investment strategy, and money flow analysis offers unique insights into investor behavior. By monitoring the relationship between money flow and overall market sentiment, traders can make more informed decisions about their positions.
5. Stay Updated on Market Events: Being aware of significant news, earnings reports, or economic data releases can help traders anticipate changes in money flow. By staying informed, traders can adjust their strategies accordingly to maximize profits and minimize losses.
6. Regularly Review Money Flow Data: Periodically reviewing your money flow analysis can provide valuable insights into changing market trends and conditions. For example, a sudden shift from positive to negative money flow could indicate an emerging trend reversal that requires action.
7. Employ Multiple Money Flow Indicators: While the Chaikin money flow oscillator and MFI are popular choices, other money flow indicators may suit specific trading styles or market conditions better. Experimenting with different indicators can help traders find the one best suited for their needs.

Money Flow and Behavioral Finance
Money flow analysis is a crucial tool for traders as it offers insights into the behavior of market participants, making it an essential element of technical analysis. This technique helps understand how investors and traders are reacting to price movements in a particular asset, shedding light on their collective sentiments. The connection between money flow and behavioral finance lies in understanding how emotions and cognitive biases can impact the markets.
Investor sentiment is an essential factor that influences market prices. Money flow analysis provides insights into these underlying emotions by measuring buying and selling pressure in a non-directional way, allowing traders to identify potential trends before they become apparent. By evaluating money flow patterns, we can better understand the market’s collective perception of a particular asset.
The relationship between money flow and behavioral finance can be seen most clearly in the case of market anomalies like the January Effect or the Size Effect. The January Effect refers to the tendency of stocks to outperform in January. Money flow analysis reveals that investors buy more shares at the beginning of the year, leading to positive net flows, which helps explain these price movements.
Another example is the size effect, which suggests smaller companies tend to provide higher returns compared to larger ones over time. Money flow data shows that small cap stocks often experience more significant volume spikes, suggesting greater investor interest and potentially setting them up for strong gains.
Additionally, the concept of herding behavior in financial markets can lead to trends or bubbles. Money flow analysis can help identify these trends by revealing shifts in buying and selling pressure. For instance, if money flow data shows a significant increase in net positive flows in a particular asset, it could be an early indicator that a bull market is forming.
Furthermore, understanding the relationship between money flow and behavioral finance can aid traders in managing their emotions during volatile markets. By examining the collective buying and selling pressure, traders can make informed decisions based on the overall trend rather than reacting to short-term price fluctuations driven by fear or greed.
In conclusion, money flow analysis plays a crucial role in understanding market behavior and investor sentiment. By evaluating money flow patterns, traders can identify trends, anticipate potential market moves, and manage their emotions effectively. The connection between money flow and behavioral finance provides valuable insights into the collective actions of market participants, making it an essential tool for any serious trader or investor.

FAQs
What is Money Flow?
Money flow, also known as volume-weighted average price (VWAP), measures the amount of capital that flows in or out of a security over a specific period. It is calculated by multiplying the daily trading volume with the high, low, and closing prices and then averaging those results. By comparing money flow figures from one day to the next, traders can determine whether money flow was positive or negative and assess the trend’s direction.
What’s the difference between Positive Money Flow and Negative Money Flow?
Positive money flow indicates that a stock is purchased at a higher price (an uptick), while negative money flow occurs when the next trade is purchased at a lower price (a downtick). When more shares are bought on upticks than downticks, net money flow is positive. If a stock’s price rises with negative money flow, this could signify an imminent reversal.
How does Money Flow differ from Volume?
Volume represents the number of shares traded in a given period, while money flow takes both price and volume into account to create a single figure that reflects the actual amount of capital flowing between buyers and sellers. This additional perspective can help traders make more informed decisions based on buying and selling pressure.
What are some popular Money Flow Indicators?
Two well-known money flow indicators are the Chaikin money flow oscillator and the money flow index (MFI). The Chaikin money flow oscillator plots buying and selling pressure as separate lines, while the MFI divides net positive money flow by net negative money flow to create a single value that traders can compare against the security’s price.
How do I interpret Money Flow Data?
Analyzing money flow data involves identifying trends in the net money flow figure over time, understanding how those figures relate to stock prices, and recognizing potential divergences between the two. Additionally, using multiple indicators and technical analysis techniques can help traders make more informed decisions based on the money flow data.
 Next entry · No. 3,248Understanding Money Laundering: Techniques, Prevention and Impact
See also
-
 No. 4,762
14 Jul 2025
19 min
Understanding the Importance and Calculation of Stockholders’ Equity
Business Finance
No. 4,762
14 Jul 2025
19 min
Understanding the Importance and Calculation of Stockholders’ Equity
Business Finance -
 No. 2,298
26 Dec 2024
18 min
Income From Operations: An Essential Concept for Institutional Investors
Business Finance
No. 2,298
26 Dec 2024
18 min
Income From Operations: An Essential Concept for Institutional Investors
Business Finance -
 No. 4,519
25 Jun 2025
23 min
Understanding Rolling Returns: Analyzing Investment Performance with Annualized Average Returns
Financial Data Analysis
No. 4,519
25 Jun 2025
23 min
Understanding Rolling Returns: Analyzing Investment Performance with Annualized Average Returns
Financial Data Analysis -
 No. 5,868
14 Oct 2025
18 min
Understanding Yield Basis: A Comprehensive Guide for Institutional Investors
Business Finance
No. 5,868
14 Oct 2025
18 min
Understanding Yield Basis: A Comprehensive Guide for Institutional Investors
Business Finance -
 No. 5,863
14 Oct 2025
21 min
Understanding Yield Maintenance: A Prepayment Penalty for Institutional Investors
Business Finance
No. 5,863
14 Oct 2025
21 min
Understanding Yield Maintenance: A Prepayment Penalty for Institutional Investors
Business Finance -
 No. 5,618
24 Sep 2025
19 min
Understanding Warrant Premiums: A Comprehensive Guide
Business Finance
No. 5,618
24 Sep 2025
19 min
Understanding Warrant Premiums: A Comprehensive Guide
Business Finance