Understanding the McClellan Oscillator: A Comprehensive Guide for Institutional Investors

Explore the ins and outs of the McClellan Oscillator, a powerful tool for institutional investors seeking to understand stock market trends.
Introduction to the McClellan Oscillator
The McClellan Oscillator is a powerful market breadth indicator that has proven itself valuable to institutional investors seeking insights into stock exchange trends and shifts in investor sentiment. Developed by Sherman and Marian McClellan, this innovative tool helps analyze the strength of an index trend through divergence or confirmation, offering valuable information for portfolio management and risk assessment strategies.
At its core, the McClellan Oscillator measures the difference between the number of advancing and declining stocks in a given exchange over specific time frames, generating a value that can be used to identify potential trend reversals, confirm index movements, or detect divergence. This section offers an in-depth exploration into the purpose, background, calculation process, interpretation, and advantages of using the McClellan Oscillator in your investment strategy.
Understanding the Basics: Purpose and Calculation
The McClellan Oscillator is designed to provide insights into stock market trends by measuring the difference between advancing and declining stocks within a specific exchange, such as the New York Stock Exchange (NYSE) or NASDAQ. This indicator can be applied to any group of stocks, making it an essential tool for institutional investors seeking a comprehensive understanding of market dynamics.
The calculation process involves tracking advances and declines over 19 and 39 days, calculating their simple moving averages (EMA), and then applying these values to the McClellan Oscillator formula. The indicator’s value fluctuates based on these calculations, providing valuable information for trend analysis and potential divergence or confirmation signals.
Determining Market Trends: Positive and Negative Values
The McClellan Oscillator provides essential insights into the current state of a stock market trend by generating positive or negative values based on its calculations. A reading above zero helps confirm a rise in the index, while readings below zero confirm a decline in the index. This information can be used to assess the overall health and direction of an exchange, offering valuable context for portfolio management decisions.
Interpreting Divergence Signals
One of the most powerful applications of the McClellan Oscillator is its ability to identify potential trend reversals through divergence signals. When the index is rising but the oscillator is falling, this warns that the index could start declining as well. Conversely, when the index is falling and the oscillator is rising, it suggests an upcoming trend reversal or continuation of an uptrend. These divergence signals can help institutional investors react to market shifts more effectively and capitalize on emerging trends.
Advantages and Limitations: Making Informed Decisions
The McClellan Oscillator offers numerous advantages for institutional investors, including its ability to confirm index trends, identify potential reversals, and provide insights into investor sentiment. However, it is essential to remember that no single indicator can guarantee success in the complex world of finance and investment. It’s crucial to consider the McClellan Oscillator as one tool among many and use it in conjunction with other indicators, price action analysis, and fundamental research for a well-rounded approach to portfolio management.
In the following sections, we will delve deeper into the history of the McClellan Oscillator, its mathematical formula, and real-world applications to further enhance your understanding of this essential market breadth indicator.

Background and History of the McClellan Oscillator
The McClellan Oscillator is an essential market breadth indicator, developed by Sherman and Marian McClellan in 1969. It was designed to identify trend reversals and confirm index trends based on the number of advancing and declining issues on a stock exchange. Originally created for the New York Stock Exchange (NYSE), it is now widely used across various stock exchanges worldwide, including NASDAQ.
The McClellan Oscillator calculates the difference between the 19-day Exponential Moving Average (EMA) and the 39-day EMA of advances and declines in a stock exchange. A positive reading indicates a rising index trend, while a negative reading confirms a falling index trend. The McClellan Oscillator’s ability to detect divergence between the indicator’s trend and the price trend makes it a valuable tool for institutional investors seeking to maximize returns and minimize risk.
The McClellan Oscillator formula has two versions: the original and an adjusted version that considers changes in the number of stocks listed on stock exchanges, which is more suitable for comparing values over longer periods. In both cases, calculating the McClellan Oscillator involves determining the 19-day EMA and 39-day EMA of advances and declines (or Adjusted Net Advances and Declines, ANA), using these values to calculate the indicator, and updating calculations daily.
The McClellan Oscillator’s significance lies in its ability to confirm index trends and reveal strong shifts in sentiment, known as breadth thrusts, which can indicate potential trend reversals. A substantial change from a negative reading to a positive one is referred to as a bullish breadth thrust, indicating that an uptrend may be underway on the stock exchange.
In summary, the McClellan Oscillator has a rich history and is widely used by institutional investors for analyzing market trends and identifying potential trend reversals based on market breadth. By understanding its background and the various formulas involved in calculating this essential indicator, investors can effectively use it in conjunction with other technical tools to optimize their investment strategies.
As institutional investors, you will want to familiarize yourself with this powerful indicator and understand how it works. Stay tuned for our next section where we dive deeper into the mathematical formula and calculation of the McClellan Oscillator.

The Mathematical Formula and Calculation of the McClellan Oscillator
The McClellan Oscillator, a well-respected market breadth indicator, was developed by Sherman and Marian McClellan in 1969. This powerful tool is based on the difference between advancing and declining issues on a stock exchange, helping investors gauge strong shifts in sentiment, predict trend changes, and assess index trends’ strength via divergence or confirmation.
The formula for calculating the McClellan Oscillator involves two primary components: the original formula and the adjusted one. The primary distinction between these formulas lies in their approach to addressing changes in the number of listed stocks on the stock exchange.
Original McClellan Oscillator Formula
The original McClellan Oscillator is calculated using the following steps:
- Calculate the 19-day Exponential Moving Average (EMA) and 39-day EMA for Advances – Declines on a specific stock exchange.
- Subtract the 39-day EMA from the 19-day EMA to obtain the McClellan Oscillator value.
Adjusted McClellan Oscillator Formula
Incorporating changes in the number of stocks listed on the exchange, the adjusted formula uses Adj. Net Advances (ANA) instead of Advances – Declines. The steps for calculating the adjusted McClellan Oscillator are:
- Determine the 19-day EMA and 39-day EMA for Adj. Net Advances (ANA).
- Subtract the 39-day EMA of ANA from the 19-day EMA of ANA to obtain the adjusted McClellan Oscillator value.
Both formulas provide valuable insights into the stock market, but their interpretation may differ depending on the specific circumstances and trends in play. To better understand these differences, let us explore how the McClellan Oscillator can be used to interpret positive or negative readings, divergence signals, and breadth thrusts.
Stay tuned for the following sections, where we will delve deeper into the importance and relevance of the McClellan Oscillator in the context of institutional investing. In the next section, we will discuss the background and history of this powerful stock market indicator.
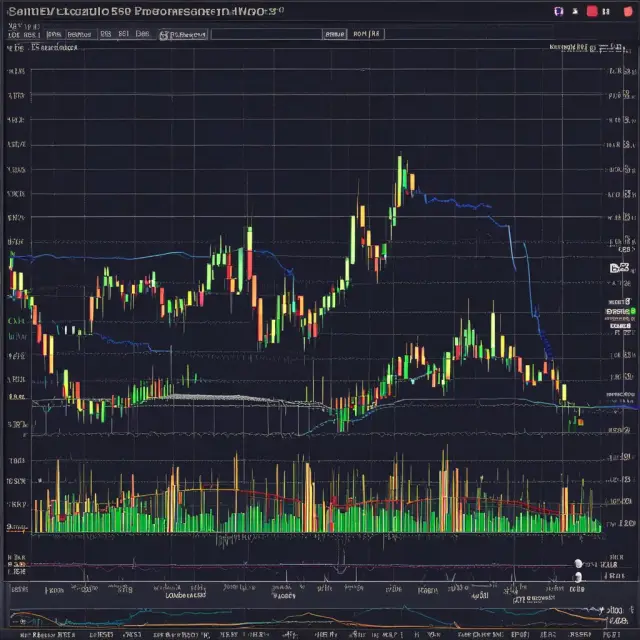
Interpreting the McClellan Oscillator: Positive, Negative, and Divergence Signals
The McClellan Oscillator provides valuable insights into market sentiment by highlighting strong shifts in stock exchange trends through positive, negative readings, and divergence signals. The indicator’s primary purpose is to help investors confirm or predict trend reversals based on the relationship between advancing and declining stocks within an index.
Positive Signals: When the McClellan Oscillator value is above zero, it confirms a rising index trend. A positive reading indicates that more stocks are advancing than declining in the exchange or index being analyzed. This situation can be particularly helpful when the price action of an index is uncertain and an investor may need confirmation of an uptrend’s continued strength.
Negative Signals: Conversely, a McClellan Oscillator value below zero confirms a declining trend in the index or exchange being analyzed. In this scenario, more stocks are declining than advancing, and the oscillator helps investors recognize that the downtrend could continue. Negative readings can provide valuable insights for short sellers seeking to profit from falling stock prices.
Divergence Signals: One of the most significant advantages of using the McClellan Oscillator is its ability to generate divergence signals, which can help investors anticipate potential trend reversals. When an index or exchange price movement and the oscillator’s values are moving in opposite directions, a divergence occurs. For example, if an index is making new highs but the McClellan Oscillator is not making new highs or is even declining, it signals that the upward trend could be losing steam (bearish divergence). Conversely, bullish divergence can occur when an index forms lower lows but the McClellan Oscillator forms higher lows, indicating a potential trend reversal. These divergences often precede significant price movements in the underlying index or exchange and are valuable tools for long-term investors to consider when making investment decisions.
A strong understanding of the McClellan Oscillator’s positive, negative readings, and divergence signals is essential for institutional investors seeking to maximize their portfolio’s performance by anticipating trend reversals and staying informed about market sentiment. In the following sections, we will explore how the McClellan Oscillator can be used in conjunction with other indicators for even more effective analysis.

Advantages and Disadvantages of Using the McClellan Oscillator
The McClellan Oscillator is a valuable tool for institutional investors seeking to gain insights into the overall health and direction of the stock market. This indicator, which measures the difference between the number of advancing and declining issues on a stock exchange, provides unique advantages when compared to other technical indicators. In this section, we will discuss both the strengths and limitations of using the McClellan Oscillator for institutional investors.
Strengths:
- Market Breadth Perspective: The McClellan Oscillator offers a market breadth perspective, meaning it looks beyond individual stocks to assess the sentiment of the entire stock exchange. This information can provide a more comprehensive understanding of market dynamics and help investors make more informed decisions.
- Confirmation and Divergence Signals: Positive or negative readings in the McClellan Oscillator can confirm uptrends or downtrends in an index, while divergence signals may indicate impending trend reversals or shifts. This information can be essential for adjusting investment strategies accordingly.
- Adaptable to Different Markets: The McClellan Oscillator can be applied to various stock exchanges and groupings of stocks, making it adaptable to different market conditions. This flexibility allows institutional investors to leverage the indicator’s insights regardless of their specific focus or investment style.
- Customizable Parameters: By using different moving average periods in the calculation (19-day vs. 39-day), investors can adjust the sensitivity and responsiveness of the McClellan Oscillator to various market conditions. This customization allows for more effective application of the indicator in diverse investment scenarios.
- Combination with Other Indicators: The McClellan Oscillator can be used in conjunction with other technical indicators, enhancing its overall utility and effectiveness. For example, it can complement momentum indicators, such as moving averages or Relative Strength Index (RSI), to provide a more complete analysis of market trends and price action.
Limitations:
- Choppy Market Conditions: The McClellan Oscillator may produce false signals during choppy markets due to its sensitivity to short-term price movements. This can result in increased noise and potential for incorrect interpretations, making it crucial for investors to confirm the indicator’s readings with other analysis methods or market conditions.
- High Frequency of Signals: The McClellan Oscillator generates a significant number of signals throughout its usage, which may lead to information overload and difficulty in determining which signals are significant enough to act upon. Careful consideration must be given to the quality and reliability of each signal before making any investment decisions based on them.
- Overreliance on the Indicator: While the McClellan Oscillator provides valuable insights, it should not be the sole decision-making tool for institutional investors. Instead, it should be used as part of a broader analysis strategy that includes other fundamental and technical indicators to ensure a well-rounded understanding of market conditions and potential investment opportunities.
- Complexity: The McClellan Oscillator’s calculation involves multiple steps and the use of exponential moving averages (EMA), which can make it more complex compared to simpler indicators. This complexity may deter some investors from using it, but the additional effort is often worthwhile due to its unique insights and potential benefits.
In conclusion, the McClellan Oscillator offers numerous advantages for institutional investors seeking a comprehensive understanding of market breadth and trends. Its confirmation and divergence signals, adaptability to different markets, customizable parameters, and combination with other indicators make it an essential tool in any sophisticated investment strategy. However, its limitations must be recognized and addressed through careful analysis and application of multiple tools to maximize the effectiveness of this powerful market indicator.
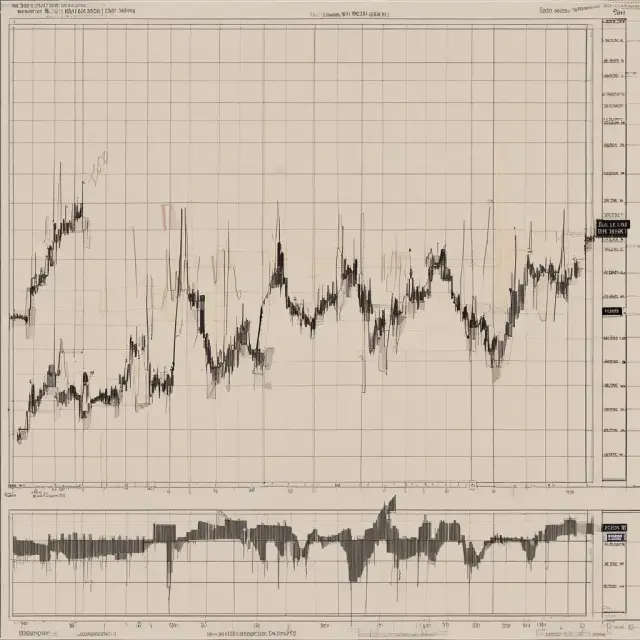
How to Use the McClellan Oscillator in Conjunction with Other Indicators
The McClellan Oscillator is a powerful tool for identifying trend reversals and market breadth, but it isn’t the only indicator that can provide valuable insights into the stock market. Incorporating other indicators alongside the McClellan Oscillator can strengthen your investment analysis, confirm trends, and improve overall accuracy in determining potential entry and exit points. Let us explore some popular technical indicators that can be used in conjunction with the McClellan Oscillator for a more comprehensive approach to stock market analysis.
Moving Averages
Moving averages, such as Simple Moving Average (SMA) or Exponential Moving Average (EMA), are commonly used indicators that help smooth out price data and provide a clearer understanding of the underlying trend direction. By comparing moving average lines with the McClellan Oscillator, you can assess the strength and validity of market trends and potential reversals. For instance, when the McClellan Oscillator gives a buy signal but the short-term moving average is still bearish, it may indicate that the trend isn’t ready to reverse yet. Conversely, when both the McClellan Oscillator and moving averages align in a specific direction, it suggests a more reliable trend confirmation.
Relative Strength Index (RSI)
The Relative Strength Index (RSI) is another popular momentum indicator that measures the magnitude of recent price changes to determine overbought or oversold conditions within an asset. This indicator ranges from 0 to 100 and helps identify potential reversals by measuring price momentum in either direction. A reading above 70 indicates an overbought condition, while a reading below 30 indicates an oversold condition. By comparing the RSI and McClellan Oscillator, you can confirm trend strength and validate potential entry or exit points. For instance, if the McClellan Oscillator suggests a bullish reversal but the RSI remains bearish, it may indicate that the market still needs to experience further declines before turning bullish.
Bollinger Bands
Bollinger Bands are volatility indicators used to measure the price range of an asset over a given period. The bands consist of three lines: the middle band, which is a moving average, and two outer bands that represent a standard deviation above or below the moving average. By observing how the McClellan Oscillator reacts in relation to Bollinger Bands, you can identify potential breakouts, trends, and volatility patterns. For example, if the McClellan Oscillator starts to diverge from the price action within the Bollinger Bands, it may suggest a trend reversal or potential volatility event.
Incorporating these indicators into your analysis can provide valuable insights and help confirm trends identified by the McClellan Oscillator. However, it is essential to remember that no single indicator is foolproof and should be used in conjunction with other analytical tools and market research. Additionally, understanding the specific parameters of each indicator and their application is crucial for accurate analysis and informed investment decisions.

Real-World Applications and Case Studies of the McClellan Oscillator
The McClellan Oscillator, developed by Sherman and Marian McClellan, is a powerful market breadth indicator that has been utilized extensively by technical analysts for over five decades to analyze the overall state of the stock market and assess the strength of its current trend. By measuring the difference between the number of advancing and declining stocks on an exchange, such as the NYSE or NASDAQ, this versatile tool can provide valuable insights into potential market reversals and emerging trends. In this section, we will delve deeper into some real-world applications and case studies that highlight the McClellan Oscillator’s effectiveness in various market conditions.
Stock Market Reversals: A Powerful Signal
One of the most significant uses for the McClellan Oscillator is the identification of major stock market reversals, particularly those that occur following a prolonged downtrend or bear market. For instance, during the 1974 bear market, the McClellan Oscillator registered a powerful bullish divergence in early November of that year (Figure 1). While the NYSE index continued to slide, the oscillator began to trend upward, indicating a growing number of stocks were showing signs of strength. This discrepancy between price and breadth was an early signal that the bear market may have reached its bottom and that a bull market was on the horizon.
Figure 1: Bullish divergence during the 1974 bear market
Identifying Trend Strength: A Confirmation Tool
The McClellan Oscillator is also an excellent confirmation tool for analyzing the strength of existing trends in major indexes, such as the S&P 500. For example, during the technology bubble of the late 1990s, the McClellan Oscillator provided a clear indication that the uptrend was losing steam (Figure 2). As the NYSE index continued to rise, the oscillator began to trend downward, signaling that breadth was deteriorating and potentially hinting at an impending trend reversal. This early warning proved crucial for investors looking to exit their positions before significant losses were incurred.
Figure 2: Divergence during the late 1990s technology bubble
Assessing Market Conditions: A Versatile Indicator
The McClellan Oscillator’s ability to measure market breadth also makes it an invaluable tool for assessing various market conditions. For instance, during periods of consolidation or choppy markets, the oscillator can help identify when trends are likely to resume or reverse. In such cases, studying the McClellan Oscillator’s behavior and comparing it to other technical indicators can provide valuable insights into potential price movements and overall market direction.
Moreover, during periods of prolonged uptrends or bull markets, the oscillator can help identify overbought conditions, which may signal that a correction is on the horizon. Conversely, during bear markets or extended downtrends, the McClellan Oscillator can provide insight into potential oversold conditions, potentially signaling that a trend reversal may be imminent.
Combining the McClellan Oscillator with Other Indicators: A Powerful Approach
While the McClellan Oscillator is a powerful indicator on its own, it is often most effective when used in conjunction with other technical indicators, such as moving averages or trend lines. Combining these tools can help investors build a more comprehensive understanding of market conditions and potential trends. For instance, using the McClellan Oscillator to confirm trend reversals identified by moving averages can provide stronger entry and exit signals. Similarly, using the oscillator in conjunction with other breadth indicators, such as the McClellan Summation Index or On-Balance Volume (OBV), can offer additional confirmation of emerging trends.
In conclusion, the McClellan Oscillator is a versatile and powerful market breadth indicator that has been instrumental in helping investors navigate various market conditions over the past half-century. By measuring the difference between advancing and declining stocks on an exchange, this tool can provide early warnings of potential trend reversals, confirm existing trends, and help assess overall market conditions. Whether used alone or in conjunction with other technical indicators, the McClellan Oscillator remains an indispensable resource for any serious investor looking to maximize returns and minimize risk.

Best Practices for Utilizing the McClellan Oscillator Effectively
The McClellan Oscillator is a powerful tool for institutional investors seeking to gauge stock exchange trends and identify potential market shifts. However, for optimal performance, it’s crucial to employ best practices when using this indicator. Here are some tips for maximizing the effectiveness of the McClellan Oscillator in your investment strategy:
1. Understand the thresholds: Be aware of significant threshold values that can provide valuable insights into market trends. A breadth thrust, which occurs when the oscillator moves from a negative reading to a positive one with a substantial difference, is an essential bullish signal. Keep track of these thresholds and use them as potential entry or exit points in your investment strategy.
2. Utilize moving averages: Combine the McClellan Oscillator with moving averages to enhance its predictive power. For example, you can observe how the indicator behaves when it crosses above or below specific moving averages, such as the 50-day and 200-day moving averages. This approach can help confirm trend changes and provide more accurate buy/sell signals.
3. Monitor divergence: Pay close attention to the relationship between the McClellan Oscillator and the underlying index or stock exchange. When the oscillator shows a bullish divergence (rising while the index is falling), it can signal an impending trend reversal, potentially signaling a buying opportunity for institutional investors.
4. Consider market conditions: The McClellan Oscillator may perform differently in various market environments. For instance, during sideways markets, the indicator might show frequent whipsaws and generate numerous false signals. Being aware of these market conditions can help investors make informed decisions when using the oscillator.
5. Backtest your strategy: Before implementing any investment strategy based on the McClellan Oscillator, it’s essential to backtest your approach with historical data. This step can help you assess the indicator’s performance during different market conditions and validate its effectiveness in various scenarios.
6. Integrate multiple indicators: To improve overall accuracy, consider combining the McClellan Oscillator with other technical indicators. For example, pairing it with moving averages, relative strength index (RSI), or stochastic oscillator can provide a more comprehensive understanding of market trends and help confirm potential trading signals.
7. Set clear entry/exit rules: Establish clear entry and exit criteria based on the McClellan Oscillator’s signals. This approach will enable you to make consistent decisions, reduce emotional biases, and minimize losses in your portfolio.
By following these best practices when utilizing the McClellan Oscillator, institutional investors can maximize its potential for identifying market trends and generating profitable investment opportunities. Remember that no single indicator is foolproof, so always consider combining it with other analytical tools and thorough fundamental analysis to make informed investment decisions.
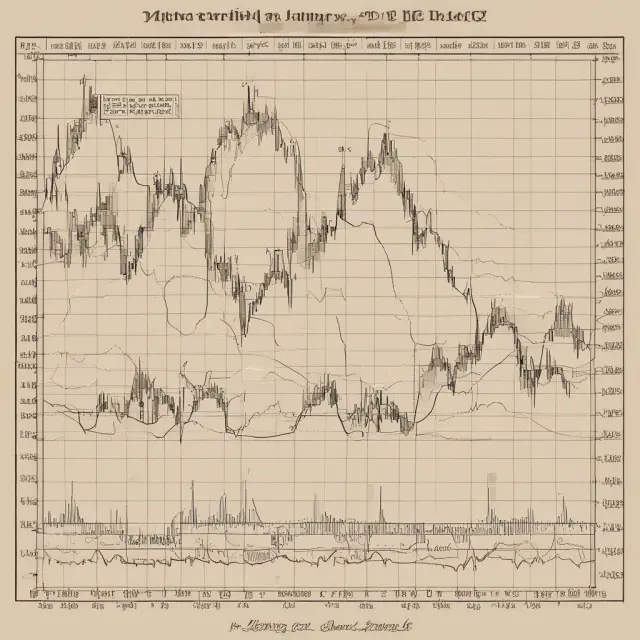
Updating Your Portfolio Based on McClellan Oscillator Signals
The McClellan Oscillator, a powerful breadth indicator, offers valuable insights into stock exchange trends and shifts in sentiment. As an institutional investor, implementing the McClellan Oscillator to inform your investment decisions can yield significant returns. Let’s dive into how you can effectively update your portfolio based on this oscillator’s signals.
A key aspect of utilizing McClellan Oscillator signals is understanding the significance of positive and negative readings. A positive reading, which occurs when the 19-day EMA (Exponential Moving Average) is above the 39-day EMA, confirms a rising index trend, suggesting that stocks are being accumulated on average. Conversely, a negative reading, where the 19-day EMA is below the 39-day EMA, signifies a declining trend, with more stocks being sold than bought.
One essential strategy to capitalize on McClellan Oscillator signals involves monitoring divergence between index price movements and oscillator values. Bullish divergence occurs when the oscillator is rising while the index is falling, indicating that the number of advancing stocks is increasing despite a declining index price. This bullish divergence may suggest an upcoming trend reversal or a potential bottom in the index being tracked, offering an opportunity for buying.
On the other hand, bearish divergence arises when the oscillator is falling while the index is rising. The decreasing number of advancing stocks despite a rising index price indicates that the uptrend may be weakening or even reversing. Institutional investors can consider selling or repositioning their portfolio to benefit from this potential shift in the market trend.
Furthermore, significant moves from negative readings to positive territory, known as breadth thrusts, can serve as powerful indicators for substantial trend reversals. A large breadth thrust occurs when there is a notable increase in advancing stocks, often 100 points or more, signaling a strong shift from downtrend to uptrend in the index. This bullish signal may suggest an excellent opportunity to invest in the market, as prices could be heading higher overall.
Lastly, it is essential to note that McClellan Oscillator signals should not be relied upon solely but rather used in conjunction with other technical indicators and price action analysis. The market can experience false signals, so it’s vital to study the oscillator’s behavior over extended periods and across various market conditions before implementing any investment strategies based on its signals.
In conclusion, the McClellan Oscillator provides valuable insights into stock exchange trends and shifts in sentiment that can significantly impact your portfolio as an institutional investor. By understanding how to interpret the oscillator’s positive and negative readings, monitoring divergence, recognizing breadth thrusts, and using it in conjunction with other technical indicators, you can make informed decisions and effectively update your portfolio based on this powerful market breadth indicator.

FAQs about the McClellan Oscillator
The McClellan Oscillator is a powerful stock market indicator used by institutional investors to identify strong shifts in sentiment and assess the strength of index trends through divergence signals. Below, we address some frequently asked questions (FAQs) about this popular technical tool.
What is the difference between the McClellan Oscillator and other indicators?
The McClellan Oscillator is a market breadth indicator that focuses on the difference between advancing and declining stocks, while other indicators like moving averages focus more on price movements. By examining trends in the number of advancing and declining issues, the McClellan Oscillator provides valuable insights into overall market sentiment.
What is the historical background of the McClellan Oscillator?
Developed by Sherman and Marian McClellan, the McClellan Oscillator was first introduced in 1969. Its unique approach to analyzing stock market trends has made it a popular choice for institutional investors looking to identify emerging trends and confirm price movements using divergence signals.
How is the McClellan Oscillator calculated?
The McClellan Oscillator formula involves comparing the 19-day exponential moving average (EMA) of advancing issues to the 39-day EMA of advancing issues. The indicator’s value can be positive or negative depending on whether more stocks are advancing or declining.
What do positive and negative readings mean in the McClellan Oscillator?
Positive values indicate that a higher number of stocks are advancing compared to declines, while negative values suggest the opposite. These readings can be used to confirm uptrends or downtrends in the stock market and provide insight into potential trend reversals.
How does divergence affect the McClellan Oscillator?
Divergence occurs when the price of an asset and the McClellan Oscillator are moving in opposite directions. For instance, a bullish divergence—where the oscillator is rising while prices are falling—suggests that the downtrend may be weakening, potentially leading to a trend reversal.
What is the significance of breadth thrusts in the McClellan Oscillator?
A breadth thrust is a significant shift from negative to positive territory in the McClellan Oscillator. This event can indicate a strong reversal from downtrend to uptrend and may signal that a bottom is forming in the stock market or an index being tracked.
Are there any limitations to using the McClellan Oscillator?
Although the McClellan Oscillator offers valuable insights into market trends, it can generate false signals, especially in choppy markets or during times of high volatility. To increase its effectiveness, use the McClellan Oscillator in conjunction with other indicators and price action analysis.
 Next entry · No. 3,154Understanding Measuring Natural Gas with MCF: A Guide for Institutional Investors
See also
-
 No. 3,233
12 Mar 2025
24 min
Momentum Investing 101: A Comprehensive Guide for Institutional Investors
Business Finance
No. 3,233
12 Mar 2025
24 min
Momentum Investing 101: A Comprehensive Guide for Institutional Investors
Business Finance -
 No. 5,719
02 Oct 2025
20 min
Understanding Wide-Ranging Days in Finance: Predicting Trend Reversals with Technical Indicators
Finance Policy
No. 5,719
02 Oct 2025
20 min
Understanding Wide-Ranging Days in Finance: Predicting Trend Reversals with Technical Indicators
Finance Policy -
 No. 3,377
23 Mar 2025
19 min
Understanding the Neckline: A Key Component of Head and Shoulders Chart Patterns in Trading
Finance Policy
No. 3,377
23 Mar 2025
19 min
Understanding the Neckline: A Key Component of Head and Shoulders Chart Patterns in Trading
Finance Policy -
 No. 3,354
21 Mar 2025
19 min
Natural Hedges: Understanding this Risk Management Strategy for Institutional Investors
Finance Policy
No. 3,354
21 Mar 2025
19 min
Natural Hedges: Understanding this Risk Management Strategy for Institutional Investors
Finance Policy -
 No. 3,284
16 Mar 2025
20 min
Understanding Mosaic Theory: A Comprehensive Guide for Institutional Investors
Finance Policy
No. 3,284
16 Mar 2025
20 min
Understanding Mosaic Theory: A Comprehensive Guide for Institutional Investors
Finance Policy -
 No. 3,261
14 Mar 2025
19 min
Understanding Monte Carlo Simulation: A Tool for Modeling Uncertainty in Finance and Investment
Finance Policy
No. 3,261
14 Mar 2025
19 min
Understanding Monte Carlo Simulation: A Tool for Modeling Uncertainty in Finance and Investment
Finance Policy