Understanding the On-The-Run Treasury Yield Curve: Implications for Institutional Investors

Learn how to understand the On-The-Run Treasury Yield Curve and its significance for institutional investors. Differences with Off-The-Run, factors…
Introduction to On-The-Run Treasury Yield Curve
On-the-run treasury yield curves play a crucial role in the financial markets, serving as critical benchmarks for pricing fixed income securities and assessing interest rate expectations. These yield curves, which plot the current yields against maturities of recently issued U.S. Treasury securities, offer valuable insights into the term structure of interest rates and help investors make informed decisions in their investment strategies.
The on-the-run treasury yield curve stands apart from its counterpart, the off-the-run treasury yield curve, which represents a set of U.S. Treasuries, of a given maturity, that are not part of the most recent issue. On-the-run treasury yield curves, derived using yields of on-the-run securities, offer several advantages for investors and market participants. However, they also come with unique challenges and distortions.
Understanding On-The-Run Treasury Yield Curves:
On-the-run treasury yield curves reflect the most recent U.S. Treasury issuances across various maturities, making them essential for pricing fixed income securities. As the primary benchmark, they are widely used to establish a reference point in evaluating the returns of other bonds and investment strategies.
However, on-the-run treasury yield curves may exhibit distortions due to the volatility of current demand for recent supply. This volatility can lead to price distortions, as securities dealers may temporarily bid up the prices of on-the-run securities (Treasuries “on special”) to use them as hedging vehicles, making their yields less representative of underlying market conditions.
In this article, we will delve deeper into the concept of on-the-run treasury yield curves and explore their implications for institutional investors. We will discuss the differences between on-the-run and off-the-run securities, the factors influencing on-the-run yields, distortions in the curves, and their significance for investment decisions. Stay tuned as we unravel the complex relationship between on-the-run treasury yield curves and interest rates.
(Note: The subsequent sections will cover each of the subtopics mentioned in this introduction in more detail.)

Key Differences between On-The-Run and Off-The-Run Treasury Yield Curves
In the realm of U.S. Treasuries, two main categories exist: on-the-run (OTR) and off-the-run (OTRF) securities. Both OTR and OTRF securities play crucial roles in fixed income markets; however, they differ significantly when it comes to their yield curves. The primary distinction lies in the fact that on-the-run Treasury securities are the most recently sold U.S. Treasuries, while off-the-run Treasury securities are older issues.
The on-the-run Treasury yield curve represents the current yields against maturities of these newly issued securities and serves as the benchmark for pricing fixed-income securities. In contrast, off-the-run Treasury yield curves reflect the yields of previously issued U.S. Treasuries. Understanding this difference is essential due to varying degrees of price distortion that can occur in each yield curve.
Price Distortions: A Treasury goes “on special” when its price is temporarily bid up, often as a result of increased demand from securities dealers seeking it for hedging purposes. This temporary price hike can lead to distorted on-the-run Treasury yield curves. In comparison, off-the-run Treasury yields tend to be more stable and less subject to these short-term price fluctuations, making the off-the-run yield curve a more accurate reflection of the underlying market conditions.
However, despite its occasional inaccuracies, the relevance of on-the-run Treasury yields lies in their use as benchmarks for pricing fixed income securities. Moreover, the shape of the on-the-run yield curve can provide valuable insights into the supply and demand dynamics within various segments of the market. For instance, a steeply upward-sloping on-the-run Treasury yield curve indicates strong investor demand in longer-term securities, pushing yields higher for those maturities. Conversely, a flat or downward-sloping on-the-run Treasury yield curve may suggest reduced investor interest or increased demand for shorter-term securities.
In conclusion, both on-the-run and off-the-run Treasury yield curves have their unique characteristics and relevance in the fixed income market. While on-the-run yields can be subject to distortions due to temporary price fluctuations, they remain an essential benchmark for pricing securities. Understanding these differences can help investors navigate the complex relationship between yield curve shapes and maturities, ultimately allowing them to make informed investment decisions.
To learn more about yield curves and their various shapes, stay tuned for our upcoming article on this topic. In the meantime, if you have any questions or need further clarification, feel free to reach out to us through the comments section below.

Impact of Current Supply on On-The-Run Treasury Yield Curve
Understanding the concept of On-The-Run (OTR) treasury yield curves can be crucial for institutional investors seeking to make informed decisions in the fixed-income market. OTR Treasury yields, which are derived from the most recently issued U.S. Treasury securities, serve as a primary benchmark for pricing such investments. However, it’s essential to acknowledge that current demand volatility can impact the accuracy of the on-the-run treasury yield curve due to price distortions.
An OTR Treasury yield curve contrasts with its off-the-run counterpart, where the latter refers to securities that are not part of the most recent issue. The difference between them lies in their relevance and accuracy: while on-the-run yield curves are used for benchmarking, they can be less accurate due to price distortions caused by increased current demand for recently issued treasuries.
A Treasury going ‘on special’ is a common source of volatility for on-the-run yields. This term refers to a security that experiences an increase in price driven by increased demand from dealers seeking to use it as a hedging tool. While this phenomenon can make the on-the-run treasury yield curve less accurate, it’s important to note that such discrepancies are usually temporary.
Interest rate reinvestment risks also contribute to the differences between OTR and off-the-run yields. On-the-run securities benefit from financing advantages due to their more recent issuance, causing them to offer lower yields compared to similar-maturity off-the-run securities. Consequently, institutional investors must be well-versed in the nuances of OTR treasury yield curves when formulating investment strategies.
The significance of OTR yield curves can extend beyond pricing fixed-income securities. Their shapes serve as valuable indicators of economic conditions and monetary policy expectations, providing insights into investor sentiment and market trends. Understanding these relationships is crucial for institutional investors seeking to navigate the complex world of fixed income investments.
In conclusion, on-the-run treasury yield curves are essential for pricing and evaluating fixed-income securities; however, their accuracy can be affected by current demand volatility. By recognizing the distortions that come with an OTR Treasury going ‘on special’ and accounting for interest rate reinvestment risks, institutional investors can make informed decisions in the face of this complexity.
Upcoming Sections
– Factors Influencing On-The-Run Treasury Yield Curve
– Distortions in On-The-Run Treasury Yield Curve
– Normal, Inverted, Flat Yield Curve: Implications for Institutional Investors
– Utilizing On-The-Run Treasury Yield Curve in Investment Decision Making
– Limitations of On-The-Run Treasury Yield Curve.

Factors Influencing On-The-Run Treasury Yield Curve
Understanding the on-the-run treasury yield curve involves recognizing its primary determinants, which include interest rate reinvestment risks, demand for investments, and central bank policies. The shape of the on-the-run treasury yield curve is a critical indicator of market sentiment and can significantly influence the pricing of fixed-income securities.
Interest Rate Reinvestment Risks: One crucial factor impacting the on-the-run Treasury yield curve is interest rate reinvestment risks. When an investor purchases a bond with a shorter maturity, they face the risk that when the bond matures, they will need to reinvest the proceeds into securities with lower yields. Conversely, investors purchasing longer-term bonds are rewarded for taking on the additional interest rate risk. This relationship is reflected in the shape of the yield curve.
Demand for Investments: Another significant factor influencing the on-the-run treasury yield curve is investor demand for various maturities. Institutional investors, such as pension funds and insurance companies, may have specific requirements for their fixed-income portfolios, leading to increased demand in particular segments of the yield curve. This shift in demand can result in price changes and consequent yield adjustments.
Central Bank Policies: Central banks play a pivotal role in shaping the on-the-run treasury yield curve through their monetary policies. By raising interest rates or injecting liquidity, central banks can influence short-term yields, which in turn impact the shape of the entire curve. For example, aggressive monetary tightening could cause an inversion of the yield curve, as short-term rates rise faster than long-term rates.
The on-the-run treasury yield curve’s accuracy and relevance can be influenced by several factors. Interest rate reinvestment risks, demand for investments, and central bank policies are just a few examples. As institutional investors make strategic decisions based on this benchmark, it is crucial to have a comprehensive understanding of its underlying drivers and potential distortions.

Distortions in On-The-Run Treasury Yield Curve
The on-the-run Treasury yield curve, a primary benchmark used in pricing fixed income securities, can experience distortions due to a ‘Treasury going on special.’ This phenomenon occurs when increased demand from securities dealers results in the temporary bidding up of a specific on-the-run Treasury security. The price increase creates a financing advantage that can cause this security’s yield to be less accurate than others in the curve.
On-The-Run vs Off-The-Run Treasuries: Understanding the Differences
To grasp the concept of distortions in the on-the-run Treasury yield curve, it is crucial first to distinguish between on-the-run and off-the-run treasuries. On-the-run treasuries refer to recently issued U.S. Treasuries, while off-the-run treasuries are those that were previously issued but are no longer the most recent issue. The on-the-run yield curve is derived using on-the-run securities and is used to price fixed income investments. However, its shape can be distorted by several basis points when an on-the-run Treasury goes ‘on special.’
The Bid Up of On-The-Run Securities
A ‘Treasury going on special’ happens when securities dealers seek to use the security as a hedging vehicle. This increased demand bids up the price of the on-the-run Treasury, creating a financing advantage for investors holding these bonds. As a result, the yield for that specific security will be lower than its counterparts in the curve with similar maturities, which may not enjoy such advantages.
The Impact on Investors
This discrepancy can create challenges for institutional investors who rely on the on-the-run Treasury yield curve as a benchmark for pricing fixed income securities. As a result, they need to account for this distortion when evaluating the returns of these investments and making future investment decisions.
Understanding the Causes and Consequences
A ‘Treasury going on special’ can cause short-term price distortions in the on-the-run Treasury yield curve. Although the financing advantage is temporary, it highlights the importance of considering multiple factors when evaluating yields within the curve. Understanding these dynamics can help institutional investors navigate market fluctuations and make more informed investment decisions.
Conclusion
The on-the-run Treasury yield curve plays a pivotal role in pricing fixed income securities. However, its shape can be distorted by temporary financing advantages that create discrepancies between yields for on-the-run securities and their counterparts within the same maturity range. By understanding this phenomenon and its implications, institutional investors can more effectively navigate market fluctuations and make informed investment decisions.
Normal, Inverted, Flat Yield Curve: Implications for Institutional Investors
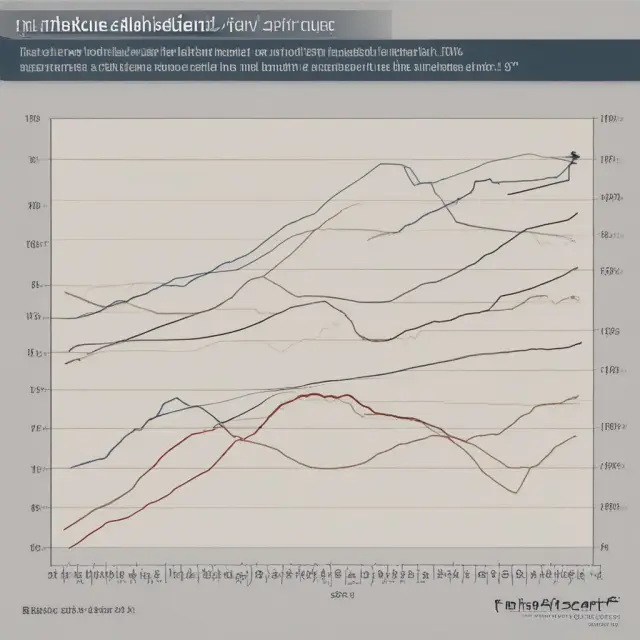
The shape of the on-the-run Treasury yield curve significantly influences investment decisions for institutional investors. Understanding this crucial benchmark requires knowledge of its common shapes – normal, inverted, and flat – and their respective implications.
A normal yield curve is characterized by an upward slope, as yield increases with maturity. This shape results from the balance between supply and demand for investments across various segments of the curve. For example, a fund focusing on securities with 5- to 10-year maturities might raise prices and lower yields in their preferred segment due to increased demand. Conversely, high demand by short-term investors can steepen the yield curve further.
An inverted yield curve is another potential shape where longer-term maturities have lower interest rates than shorter-term ones. Such a situation can be caused by aggressive central bank policies temporarily raising short-term interest rates to slow an overheating economy. Inversions are typically considered a harbinger of recession, but they can also represent a short-term aberration.
Lastly, a flat yield curve occurs when yields for both short and long maturities are approximately equal. This shape is often indicative of a transitional period where interest rates are moving from an inverted or positive slope to the opposite.
Institutional investors use the on-the-run Treasury yield curve to evaluate the returns of fixed-income securities. A normal yield curve implies that the risk premium for holding longer-term bonds increases as maturities extend. In contrast, an inverted yield curve signifies a risk premium decrease as investors are willing to accept lower yields on longer-term investments compared to shorter-term ones. Understanding these relationships allows institutional investors to make informed decisions regarding their fixed-income portfolios’ composition and potential risks.
However, it is crucial for investors to remember that the on-the-run Treasury yield curve is not perfect. As previously discussed, distortions can arise when an on-the-run Treasury goes “on special,” causing temporary price increases and lower yields. Additionally, reinvestment risk differences between on-the-run and off-the-run issues can add complexity to the interpretation of the yield curve.
In conclusion, institutional investors rely on the on-the-run Treasury yield curve as a crucial benchmark for fixed-income securities pricing and investment decision-making. Understanding the significance of different shapes – normal, inverted, and flat – is essential to navigating the complex relationship between maturity, yield, supply, demand, and central bank policies.

On-The-Run Treasury Yield Curve vs. Federal Funds Rate
Understanding the relationship between on-the-run treasury yield curves and federal funds rate is vital for institutional investors seeking a well-rounded perspective of the fixed income market. The on-the-run Treasury yield curve, which graphically shows current yields versus maturities of most recently sold U.S. Treasury securities, holds significant relevance in pricing fixed-income securities. However, it is crucial to distinguish the difference between an on-the-run Treasury yield curve and federal funds rate.
An on-the-run Treasury yield curve is derived using on-the-run Treasuries that plot yields of these instruments against their maturities. This curve differs from the off-the-run Treasury yield curve, which refers to U.S. treasuries not part of the most recent issue. On-the-run treasury yield curves can be less accurate due to price distortions caused by increased demand for these securities, known as “going on special.” This temporary increase in demand is typically driven by securities dealers seeking to use the security as a hedging vehicle.
Federal funds rate, also referred to as the federal discount rate or the overnight lending rate, represents the interest rate at which depository institutions lend and borrow reserve balances from each other on an overnight basis. The Federal Open Market Committee (FOMC), which is a part of the Federal Reserve System, sets the federal funds rate.
While both indicators offer valuable insights into the health of the economy, their differences lie in their composition, relevance to specific investments, and impact on broader market conditions. For instance, an upward-sloping on-the-run Treasury yield curve reflects higher yields for longer maturities than shorter ones, while a rising federal funds rate points towards tightening monetary policy.
Investors must closely monitor both indicators to assess market trends and make informed investment decisions. Understanding the relationship between these two crucial financial measures can lead to more effective portfolio management strategies and better risk mitigation tactics in volatile markets.
The Fed’s role in setting interest rates, as indicated by the federal funds rate, has a significant impact on overall market conditions. A rise in federal funds rate generally signals expectations of higher yields for longer-term bonds, such as those reflected in the on-the-run Treasury yield curve. Conversely, a decrease in federal funds rate may suggest lower yields across the curve.
By analyzing the relationship between these two key indicators, investors can make more informed decisions regarding their fixed-income investments and overall risk management strategies. For instance, they might adjust their portfolio allocations or consider alternative investment opportunities based on changing market conditions reflected by both on-the-run Treasury yield curves and federal funds rate.
In conclusion, while both on-the-run treasury yield curves and federal funds rate offer essential insights into the fixed income market, it is crucial for institutional investors to understand their differences and interrelated nature. This knowledge can lead to better investment decisions and effective risk management in a constantly evolving financial landscape.

Utilizing On-The-Run Treasury Yield Curve in Investment Decision Making
The on-the-run treasury yield curve, as the primary benchmark for pricing fixed income securities, plays a crucial role in investment decision making. This section delves into how the shape and movement of the on-the-run treasury yield curve can offer valuable insights for institutional investors.
To begin with, understanding the typical shapes of the on-the-run treasury yield curve is essential in informing investment decisions. Generally, an upward-sloping or normal yield curve indicates increasing yields as maturities increase (Figure 1). The shape of this curve is the result of investors’ supply and demand dynamics for investments at varying maturities.
Figure 1: Normal Yield Curve
In contrast, an inverted yield curve shows higher interest rates for shorter-term maturities than longer-term maturities (Figure 2). This shape can be a reflection of aggressive central bank policies or expectations of future economic conditions. For instance, if a central bank raises short-term interest rates to combat inflation, the short end of the yield curve will increase while long-term yields remain relatively unchanged (Figure 3).
Figure 2: Inverted Yield Curve
Figure 3: Central Bank Policy Impact on Yield Curve
Additionally, observing changes in the slope and shape of the on-the-run yield curve can provide insights into future interest rate trends. For example, a flattening yield curve may indicate that the market expects short-term rates to rise faster than long-term rates (Figure 4). This information is critical for institutional investors making investment decisions in fixed income securities such as bonds and Treasury Inflation Protected Securities (TIPS).
Figure 4: Flattening Yield Curve
Moreover, the on-the-run treasury yield curve can serve as a reference point when evaluating the returns of other fixed income securities. By comparing yields against the on-the-run treasury yield curve, institutional investors can assess whether they are receiving appropriate compensation for taking additional risk. For example, if a corporate bond offers a yield that is significantly lower than the corresponding maturity on the on-the-run treasury yield curve, it may not be an attractive investment opportunity (Figure 5).
Figure 5: Corporate Bond vs On-The-Run Treasury Yield Comparison
In summary, the on-the-run treasury yield curve plays a critical role in informing investment decisions for institutional investors. By understanding its typical shapes and changes, investors can assess the attractiveness of fixed income securities and gauge future interest rate trends. It serves as an essential tool for managing risk and maximizing returns in a constantly evolving market environment.

Limitations of On-The-Run Treasury Yield Curve
The on-the-run Treasury yield curve, as the primary benchmark for pricing fixed-income securities, is a critical tool for investors. However, it comes with certain limitations and challenges when used for investment decision making and risk management.
Firstly, an on-the-run Treasury yield curve may be less accurate than off-the-run treasury yield curves due to the volatility of current demand for recent supply. When a Treasury security goes ‘on special’ (meaning its price is temporarily bid up as securities dealers use it as a hedging vehicle), this can lead to distortions in the on-the-run yield curve. These price distortions may persist, even after the cause has been removed, which could impact the accuracy and reliability of using on-the-run treasury yields as a benchmark for investment decisions.
Secondly, there are differences between on-the-run and off-the-run Treasury securities in terms of interest rate reinvestment risks. On-the-run Treasuries have an advantage as they can be financed at cheaper rates due to the higher liquidity and trading volumes, offering lower yields compared to similar maturity off-the-run treasuries. This financing advantage, however, may not be fully reflected in the on-the-run yield curve, leading to a possible discrepancy between the two curves.
The shape of the on-the-run Treasury yield curve can also deviate from that of the off-the-run Treasury yield curve due to differing interest rate reinvestment risks. As such, institutional investors need to be aware of these discrepancies and differences to make informed investment decisions based on an accurate understanding of both curves.
In conclusion, while the on-the-run Treasury yield curve is an essential tool for pricing fixed-income securities, it comes with limitations and challenges in terms of accuracy and reliability when compared to off-the-run treasury yield curves. Institutional investors must be aware of these discrepancies and differences to make informed decisions based on a comprehensive understanding of both curves. Understanding the intricacies of on-the-run and off-the-run Treasury yields, as well as their respective implications, will help investors navigate the complexities of bond markets more effectively.

Conclusion: Navigating On-The-Run Treasury Yield Curve
Understanding the on-the-run treasury yield curve plays a crucial role for institutional investors, as it is the primary benchmark used in pricing fixed-income securities. This section concludes our exploration of this critical financial concept by summarizing its relevance, key insights, and future implications.
The on-the-run Treasury yield curve represents the yields versus maturities of the most recently sold U.S. Treasury securities. It is distinct from the off-the-run Treasury yield curve, which consists of treasuries not part of the most recent issue. The volatility of current demand for recent supply can result in price distortions and make on-the-run treasury yield curves less accurate than their off-the-run counterparts. However, it remains an essential reference point due to its widespread use in pricing fixed-income securities.
The shape of the on-the-run Treasury yield curve is influenced by various factors, including interest rate reinvestment risks, demand for investments, and central bank policies. The typical shape for this yield curve is upward sloping, reflecting higher yields as maturities increase – referred to as a normal yield curve. However, an inverted yield curve can occur when short-term rates exceed long-term rates, sometimes resulting from aggressive central bank policies. A flat yield curve indicates a transitional period where short- and long-term rates are approximately equal.
Institutional investors can leverage the on-the-run Treasury yield curve to inform investment decisions by evaluating fixed-income securities against this benchmark. By monitoring its shape, they can identify changes in supply and demand for various maturities, as well as potential shifts in monetary policy that may impact their portfolios.
However, it’s essential to note that on-the-run Treasury yield curves have limitations. Price distortions due to the volatility of current demand can make them less accurate than off-the-run Treasury yields. Furthermore, the shape of the curve may not always accurately reflect underlying economic conditions or future interest rate movements. Nevertheless, the on-the-run Treasury yield curve remains a vital tool for institutional investors seeking insight into fixed-income markets and the overall economy.
In conclusion, this section has provided an overview of the on-the-run Treasury yield curve, its significance for institutional investors, and its implications. By understanding this critical concept and staying informed about its changes, investors can effectively navigate the complexities of fixed-income investing and make more informed decisions in today’s ever-changing financial landscape.

FAQs About On-The-Run Treasury Yield Curve
What is the definition of on-the-run Treasury yield curve?
Answer: The on-the-run Treasury yield curve plots the yields of the most recently sold U.S. Treasury securities against their maturities, providing a primary benchmark for pricing fixed-income securities. It’s called ‘on-the-run’ because these securities are currently in circulation, and their yields can be influenced by current supply and demand dynamics.
What is the difference between on-the-run and off-the-run Treasury yield curves?
Answer: The primary distinction lies in the age of the U.S. Treasury securities being used to generate each yield curve. On-the-run refers to the most recently issued bonds, while off-the-run represents older issues not part of the latest auction. On-the-run curves may exhibit price distortions due to temporary increased demand for hedging purposes, making them less accurate than off-the-run curves.
Why is the on-the-run Treasury yield curve significant?
Answer: The on-the-run Treasury yield curve is significant because it serves as a crucial benchmark in pricing fixed-income securities for institutional investors, and its shape can indicate economic conditions and expectations about future interest rates.
How can the shape of an on-the-run Treasury yield curve be influenced?
Answer: The shape of an on-the-run Treasury yield curve can change due to various factors such as supply and demand dynamics, interest rate reinvestment risks, central bank policies, and distortions caused by securities going ‘on special.’
What happens when a Treasury goes ‘on special’?
Answer: When a Treasury security becomes temporarily popular among investors due to increased demand for hedging purposes, its price may rise, causing the on-the-run yield curve to deviate from its expected shape. This phenomenon is known as a ‘Treasury going on special.’
What are some common shapes of an on-the-run Treasury yield curve and their implications?
Answer: A typical on-the-run Treasury yield curve can be upward sloping, inverted, or flat, each indicating different economic conditions or expectations about future interest rates. A normal (upward sloping) yield curve may indicate an expanding economy with rising long-term interest rates due to increased demand for longer-term investments. An inverted yield curve might suggest a recession is imminent, while a flat yield curve could signal a transitional period.
What is the relationship between on-the-run Treasury yield curves and federal funds rate?
Answer: The on-the-run Treasury yield curve and federal funds rate serve different purposes in financial markets. While the on-the-run Treasury yield curve plots yields of U.S. government securities, the federal funds rate is a short-term interest rate set by the Federal Open Market Committee to control inflation. Institutional investors may use both benchmarks to inform their investment decisions and risk management strategies.
How can institutional investors utilize on-the-run Treasury yield curve information?
Answer: Institutional investors can use the on-the-run Treasury yield curve to evaluate the returns of fixed income securities, compare them with alternative investments, and inform their investment decisions based on changing economic conditions and expectations about future interest rates.
What are some limitations of using an on-the-run Treasury yield curve?
Answer: The main limitation of using an on-the-run Treasury yield curve is that it can be subject to price distortions, especially when a security goes ‘on special,’ potentially misrepresenting true market conditions. Additionally, the shape of the curve may not always accurately reflect underlying economic conditions or investor sentiment.
Where can I learn more about on-the-run Treasury yield curves and their implications?
Answer: You can explore various resources from financial institutions, academic publications, and professional organizations that focus on fixed income markets, central banking, and economic analysis to gain a deeper understanding of the topic. Additionally, following leading economists and financial experts in these areas can help you stay informed about on-the-run Treasury yield curves and their implications for investors.
 Next entry · No. 3,695Understanding Optimized Portfolio As Listed Securities (OPALS): A Predecessor to Exchange-Traded Funds
See also
-
 No. 5,861
14 Oct 2025
18 min
Understanding Yield Curves: Normal, Inverted, and Flat – Predictors of Economic Transitions
Business Finance
No. 5,861
14 Oct 2025
18 min
Understanding Yield Curves: Normal, Inverted, and Flat – Predictors of Economic Transitions
Business Finance -
 No. 5,065
09 Aug 2025
19 min
Understanding TreasuryDirect: A Comprehensive Guide for Institutional Investors
Business Finance
No. 5,065
09 Aug 2025
19 min
Understanding TreasuryDirect: A Comprehensive Guide for Institutional Investors
Business Finance -
 No. 3,956
10 May 2025
19 min
Understanding Perpetual Bonds: A Deep Dive into the World of Forever-Lasting Fixed Income Securities
Business Finance
No. 3,956
10 May 2025
19 min
Understanding Perpetual Bonds: A Deep Dive into the World of Forever-Lasting Fixed Income Securities
Business Finance -
 No. 4,165
27 May 2025
19 min
Price Value of a Basis Point: Understanding How It Affects Bond Pricing
Finance Policy
No. 4,165
27 May 2025
19 min
Price Value of a Basis Point: Understanding How It Affects Bond Pricing
Finance Policy -
 No. 3,895
05 May 2025
19 min
Understanding Par Yield Curves: Plotting the YTM of Coupon-Paying Bonds at Par
Finance Policy
No. 3,895
05 May 2025
19 min
Understanding Par Yield Curves: Plotting the YTM of Coupon-Paying Bonds at Par
Finance Policy -
 No. 5,903
17 Oct 2025
24 min
Zero Percent Financing: What It Is and Why It Might Be More Expensive Than You Think
Business Finance
No. 5,903
17 Oct 2025
24 min
Zero Percent Financing: What It Is and Why It Might Be More Expensive Than You Think
Business Finance