Understanding Zones of Support in Finance and Investment: Identifying Profitable Reversal Points

Discover profitable reversal points in finance & investment through understanding the significance of zones of support. Learn methods for identification…
Definition of a Zone of Support
A zone of support is an essential concept in technical analysis, signifying a lower boundary that marks a price level where a security has not yet been breached. This level represents a significant area for traders to closely watch and consider entering or exiting trades, as it may indicate potential reversals.
The significance of a zone of support lies in its role as a resistance point that was previously a support area. A security’s price tends to rebound from these areas due to the presence of underlying demand. These zones can be identified using various technical analysis techniques such as trendlines, channels, or Fibonacci retracement levels.
Understanding a Zone of Support in Detail
A zone of support emerges when a security’s price reaches its predicted low, often referred to as a support level. This crucial area acts as a boundary for the stock’s price movements and can provide opportunities for traders looking to capitalize on potential reversals or continuation trends. A zone of support is particularly important because it represents an inflection point where the price has historically found temporary support.
The significance of this lower boundary is that supply and demand dynamics within a security are generally balanced in these areas. Support levels often form near significant support trendlines, which can be drawn by connecting past peaks and troughs. As a result, these areas attract potential traders looking to enter the market or exit their positions based on their analysis of the price action.
Technical Analysis Techniques for Identifying Zones of Support
The process of locating zones of support involves using technical analysis techniques such as:
- Envelope Channels (Bollinger Bands®, Keltner Channels, Donchian Channels)
- Trendlines
- Fibonacci Retracement
Envelope channels help traders draw continuous support and resistance boundaries around a security’s price movement. Popular envelope channel techniques include:
– Bollinger Bands ®: These bands consist of three lines – the middle band represents a moving average, while the upper and lower bands represent standard deviations.
– Keltner Channels: Keltner Channels provide volatility bands around a security’s price movement using an average true range (ATR) indicator and a midline consisting of a moving average.
– Donchian Channels: These channels utilize high and low price ranges over specific time intervals to plot upper and lower boundaries.
Trendlines can help traders identify zones of support by drawing lines connecting significant peaks and troughs, which indicates the potential for price reversals or continuation trends.
Fibonacci retracement levels provide a quantifiable tool to measure potential areas of support within a security’s trend. By applying this technique, traders can determine where price movements may retrace before continuing in their original trend direction.
Understanding Zone of Support vs. Resistance Zones
Zone of support and resistance zones differ fundamentally. While both types of zones offer insights into potential trading opportunities, a zone of support represents a lower boundary that the stock’s price has not yet breached, while a resistance zone represents an upper boundary that has previously prevented price advancement. The distinction between these two types of zones can help traders make informed decisions regarding their positions and trading strategies.
In summary, a zone of support is a crucial concept in technical analysis that highlights the lower price boundary where a security’s price has not yet been breached. By understanding how to identify these zones using various technical tools and techniques, traders can effectively capitalize on potential reversals or continuation trends.
Identifying Zones of Support with Technical Analysis
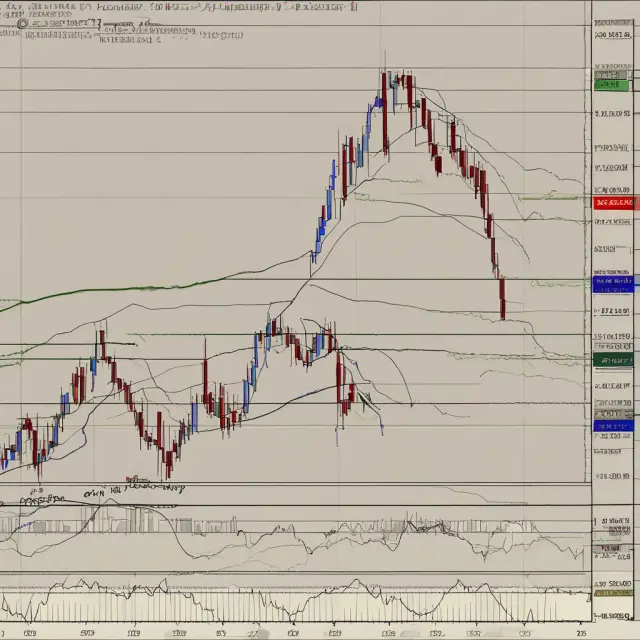
A Zone of Support is an essential concept in technical analysis used to determine potential price levels where a security may find support as its price falls. These areas are significant because they often indicate the lower boundary that a stock has not previously broken through, offering traders valuable insights for profitable trades. In this section, we will delve into popular methods of identifying zones of support using various technical analysis techniques such as envelope channels and Fibonacci retracements.
Envelope Channels: Envelope channels like Bollinger Bands®, Keltner Channels, and Donchian Channels are widely used tools for identifying potential zones of support in a security’s price chart. These channels provide continuous boundaries around the moving average price that can help traders anticipate future support or resistance levels.
Bollinger Bands®: One of the most popular envelope channels is the Bollinger Band®, which consists of three lines: a middle moving average line (simple moving average) and two standard deviation lines placed above and below it. The upper and lower bands act as dynamic support and resistance levels. When the security’s price falls close to the lower band, it may indicate that a potential zone of support is present.
Fibonacci Retracements: Another potent method for identifying zones of support is Fibonacci retracement, which uses percentages from 0% (the lowest point) to 100% (the highest point) in a price trend to draw intermediary lines that can help traders find potential trading opportunities. These lines are significant because they represent the potential levels where price action may reverse or consolidate before continuing its overall trend.
To illustrate how these techniques can be used, let’s examine Campbell Soup Company (CPB) stock data and apply both Bollinger Bands® and Fibonacci retracement to identify zones of support. By doing so, we can better understand the potential areas where the price may rebound or continue its trend.
In conclusion, a Zone of Support is an essential concept in technical analysis that provides traders with valuable insights into potential lower boundary levels for a security’s price. Envelope channels and Fibonacci retracements are two powerful techniques to identify zones of support by highlighting significant price levels where the stock may find support or reverse its trend, ultimately leading to profitable trading opportunities.
FAQ: What is the difference between a zone of support and a resistance level?
A: A zone of support is a lower boundary price level where a security’s price has not previously broken through, while a resistance level is an upper boundary price level that the security has found difficulty in penetrating consistently. While both represent potential levels for price reversal or continuation, they differ based on their position in the chart as either a support or resistance area.
Support Zone Activity: Reversals or Downside Continuation
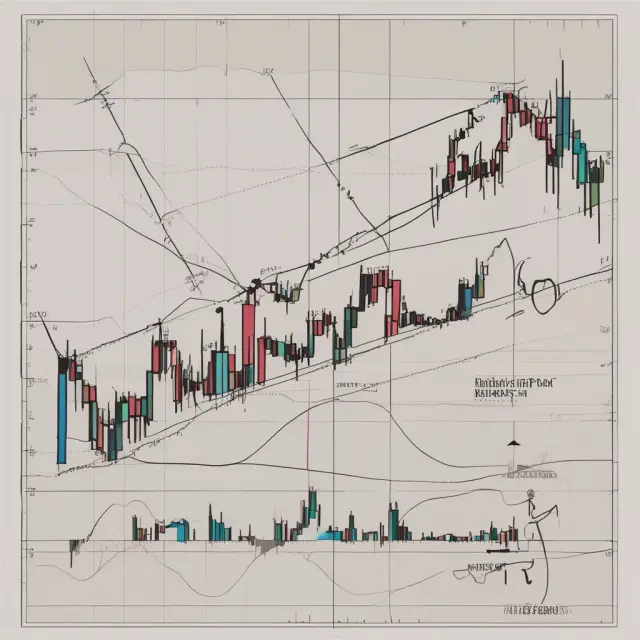
A zone of support is a critical area on a chart, serving as a lower boundary where a security’s price has not previously broken through. This level is significant because it indicates a strong underlying demand for the asset. The activity within this zone can reveal important information for traders and investors regarding potential reversals or downside continuation.
When a stock’s price falls to its support level, various factors come into play. Market forces such as supply and demand dynamics and psychological influences can create intriguing trading opportunities. If the price reacts strongly within this zone, it may indicate that buyers are entering the market, leading to a potential reversal in the trend.
On the other hand, if the price continues to decline through the support level, it could signal further downside movement. This decision is crucial for traders as it determines their entry or exit strategies in the market. Let’s dive deeper into understanding the significance of zone of support activity and how it can lead to reversals or downside continuation:
Identifying Support Zone Reversals
When a security reaches its support level, it is essential to analyze the price action closely. A bullish reversal can occur if buyers enter the market in large volumes, pushing the price back up above the support level. This price action is often characterized by an increase in trading volume and the formation of bullish candlestick patterns such as hammer or engulfing candlesticks. Traders can benefit from these reversals by entering long positions, aiming to profit from the subsequent price rise.
Support Zone Downside Continuation
Conversely, if a security’s price breaks down through its support level, it may indicate downside continuation. This situation typically results from increased selling pressure and a lack of buyers stepping in to defend the support level. Traders looking for short opportunities may enter the market at this point, expecting the trend to continue lower.
Furthermore, the size and duration of the price movement within the support zone can provide valuable insights into potential reversals or downside continuation. Longer, more significant movements that result in a strong support zone are likely to have a higher probability of a reversal than shorter, weaker moves.
Understanding these dynamics and recognizing the importance of zone of support activity is crucial for traders seeking profitable opportunities. By closely monitoring price action within the support zone and considering factors such as volume, chart patterns, and trend strength, traders can effectively time their entries and exits, capitalizing on potential reversals or downside continuation.
In conclusion, zones of support present high-probability areas for traders and investors seeking to make informed decisions regarding buying and selling opportunities in the financial markets. By analyzing price action within these zones and understanding their significance, traders can position themselves for potential profits by anticipating reversals or downside continuation.
Using Horizontal Trendlines to Determine Support Zones
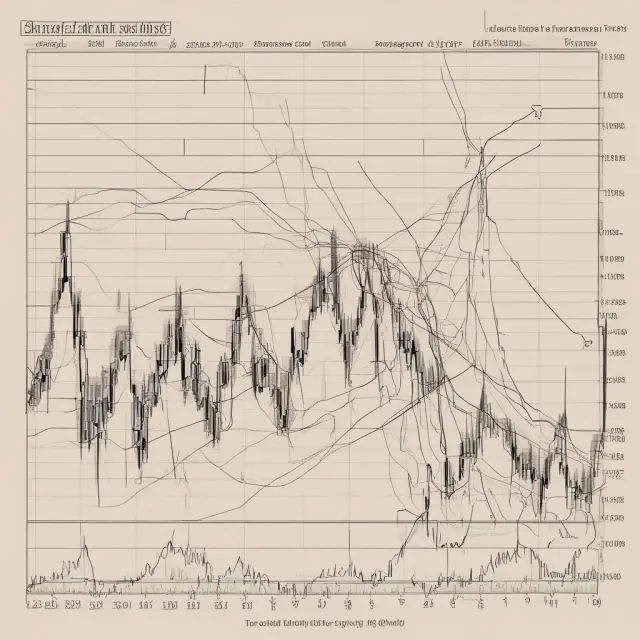
A zone of support is a crucial concept for traders as it helps identify significant areas where a security’s price has not previously broken through, acting as a potential lower boundary. Identifying these zones can lead to profitable trading opportunities, either by entering at the support level or waiting for a reversal. One effective method for determining support zones is by drawing horizontal trendlines.
Horizontal trendlines are essential technical analysis tools that traders use to visualize significant price levels and identify zones of support and resistance. They are created by connecting multiple peaks and troughs on a chart, which reveals the security’s historical trends. The two most common types of horizontal trendlines are trendlines drawn along peaks (resistance lines) and those drawn along troughs (support lines).
In determining zones of support, traders mainly focus on drawing horizontal trendlines around troughs, as these lines represent lower boundaries that the stock price has not breached in the past. These trendlines can be used to identify potential entry or exit points based on the trader’s analysis and strategy.
One popular technique for using horizontal trendlines is envelope channels. Envelope channels employ multiple timeframes to draw support and resistance levels around a security’s moving price. Three widely used envelope channel indicators are Bollinger Bands®, Keltner Channels, and Donchian Channels. These tools provide traders with upper and lower boundaries for the security’s price movements, helping them identify zones of support as well as potential reversal points.
Bollinger Bands®, for instance, calculate support and resistance levels based on a moving average and standard deviations. By default, they are set to two standard deviations from the 20-day simple moving average. Traders can adjust these settings based on their trading style and timeframes.
Another method for drawing trendlines involves using Fibonacci Retracement levels. The Fibonacci Retracement tool measures price movements by dividing the vertical distance between significant highs and lows into specific ratios, known as Fibonacci Ratios. By plotting these ratios on a chart, traders can identify potential zones of support based on historical price behavior.
When using horizontal trendlines to determine support zones, it is important for traders to consider the volatility of the security they are analyzing. Volatility plays a crucial role in defining the strength and reliability of support zones. Highly volatile securities may exhibit significant price fluctuations within the support zone, making it essential for traders to be attentive to price action and volume levels when trading within these areas.
In summary, horizontal trendlines serve as an essential tool for identifying zones of support in financial markets. By connecting significant peaks and troughs on a chart, traders can gain insights into historical price movements and potential entry or exit points based on their analysis and strategies. Envelope channels like Bollinger Bands®, Keltner Channels, and Donchian Channels, along with Fibonacci Retracement, are popular techniques for drawing trendlines and identifying zones of support in various securities and timeframes.

Benefits of Trading in a Zone of Support
Traders often find zones of support to be attractive areas for entering or exiting trades due to the increased probability for profitable opportunities. A zone of support is a price level that has proven significant resistance to downside moves and often indicates an area where a trend may reverse. The benefits of trading in a zone of support include:
- High Probability Trading Areas: Traders can capitalize on the heightened interest and potential for trend reversals that occur within zones of support. By positioning themselves within these areas, they increase their chances of making profitable trades.
- Confirmation of Trend Reversal: A clear zone of support represents a solid confirmation of an emerging uptrend. Once a security’s price breaks through the resistance level and holds above it, traders can enter long positions with confidence. Conversely, a downside break below a zone of support may indicate a continuation or extension of a downtrend, prompting short sellers to enter the market.
- Reduced Risk: Zones of support often serve as a lower risk entry point due to the price’s historical resistance to further declines. By entering at these levels, traders can minimize their potential losses while maximizing their potential gains.
- Increased Market Liquidity: Zones of support tend to attract a higher level of trader interest and activity, which in turn increases market liquidity. This enhanced liquidity makes it easier for traders to enter or exit positions at favorable prices.
- Informed Trading Decisions: Utilizing various technical analysis methods like envelope channels (Bollinger Bands®, Keltner Channels) and Fibonacci Retracement can help identify zones of support more accurately. With this information, traders can make informed decisions regarding entry points and exit strategies within these high probability areas.
- Multi-Timeframe Analysis: Trading within a zone of support is not limited to a single timeframe. Traders can analyze multiple timeframes simultaneously to determine potential opportunities and risks across different scales. This holistic approach allows traders to maximize their chances of success while minimizing the potential for losses.
- Anticipating Potential Reversal Patterns: By closely monitoring support zone activity, traders can anticipate potential reversal patterns like head and shoulders, double tops/bottoms, triangles, etc., which may signal a significant shift in market sentiment.
- Diversification: Trading within zones of support is not limited to a single security or asset class. Traders can diversify their portfolio by incorporating various securities, indices, currencies, and commodities that exhibit similar chart patterns and trends. This approach minimizes concentration risk while maximizing potential returns.
In conclusion, trading within a zone of support provides numerous benefits for investors and traders alike. These high probability areas offer a solid foundation for entering or exiting trades, reducing risk, increasing market liquidity, and making informed decisions based on reliable technical analysis techniques. By staying attentive to zones of support, traders can capitalize on the heightened interest and increased potential for profitable opportunities that these areas present.

Zone of Support vs. Resistance Zones
Support zones and resistance zones are two essential concepts used in technical analysis for understanding price movement in financial securities. Both represent distinct areas where the supply and demand dynamics interact to create trends or reversals. While support levels (zones of support) show lower boundary price levels that a security has not previously broken through, resistance levels (zones of resistance) are upper boundary price levels that have not been reached by the security without experiencing strong sell pressure.
In simpler terms, zones of support represent areas of lower prices where a stock or other financial asset tends to find a floor and bounce back after a decline, while resistance zones reflect areas where a security’s price tends to face a ceiling and halt its progress upwards. By understanding the differences between these two concepts and their implications for trading opportunities, investors and traders can gain valuable insights into market trends and improve their decision-making process.
Support zones provide an essential foundation for identifying profitable trading opportunities because they represent areas of lower price levels where the stock has not broken through before. Once a support level is breached, there is a higher likelihood that the trend will continue in the same direction. As such, it’s crucial to closely monitor the support zone activity to determine whether it signals a potential reversal or a continuation of the current downward trend.
Furthermore, support zones can be identified using various technical analysis tools and methods, including envelope channels, moving averages, horizontal trendlines, and Fibonacci Retracement levels. These indicators help traders to establish more accurate entry and exit points within the zone of support and maximize their potential profitability.
One common way to determine a support zone is by employing envelope channels such as Bollinger Bands®, Keltner Channels, and Donchian Channels. These indicators create support and resistance boundaries around a security’s price by measuring volatility and calculating moving averages. By drawing these trendlines, traders can identify the areas where the stock is less likely to fall below without encountering significant buying pressure.
For instance, Bollinger Band® charts use two standard deviations to create upper and lower bands around a security’s price. When the price reaches the lower band, it often indicates a strong support level due to high trading volume and significant market interest. Similarly, other envelope channels like Keltner Channels and Donchian Channels can help traders to pinpoint areas of potential support based on historical price trends and volatility patterns.
In conclusion, zones of support play an essential role in understanding the dynamics of financial securities by helping investors and traders to identify profitable entry and exit points. By recognizing these areas as lower boundary price levels where a stock or asset has not previously broken through, traders can capitalize on potential reversals, confirm trends, and make informed decisions based on solid technical analysis principles.

Using Software for Identifying and Analyzing Zones of Support
Advanced charting software plays a pivotal role in identifying and analyzing zones of support, making it easier for traders to spot these areas and make informed decisions based on their analysis. Such software provides essential features that can help draw support zones, display important indicators, and visualize price trends more effectively.
Popular charting tools like TradingView or MetaTrader offer robust customization options that enable users to draw horizontal trendlines around significant peaks and troughs. These lines represent key support levels, which can be valuable areas for potential entry or exit points.
One of the most widely-used envelope channels is Bollinger Bands® (BBs). This technical indicator draws two standard deviation lines above and below a security’s moving average to provide upper and lower boundaries, identifying support and resistance levels. Traders can set their bands according to different timeframes, making it adaptable for various trading strategies.
Another popular envelope channel is Keltner Channels, which applies the volatility-based approach of ATR (Average True Range) instead of standard deviation. These channels are particularly effective in identifying potential support and resistance zones, as they account for price volatility more accurately than traditional moving averages.
Donchian Channels, another type of envelope channel, uses the highest high and lowest low over a predetermined time period to set upper and lower boundaries. This method is particularly useful in volatile markets where price movements are extreme.
To fully capitalize on these support zones, traders should closely monitor their activity for signs of a reversal or further downside movement. Traders may consider entering long positions if they anticipate a rebound from the support level; alternatively, short-selling positions may be more profitable in cases where the price is expected to continue its downtrend.
By employing advanced charting software and familiarizing themselves with various technical indicators, traders can effectively identify zones of support and make informed decisions based on their analysis. These tools not only save time but also provide a higher probability for successful trades.

Understanding the Role of Volatility in a Zone of Support
The role of volatility within zones of support is an important factor that traders must consider when determining their trading strategy. The volatility level in a zone of support can impact price action, trader behavior, and potential entry/exit points for traders seeking profitable opportunities.
When discussing volatility, it refers to the measure of the degree of variation in price or return on an investment over time. Volatility is typically represented by statistical measures like standard deviation (SD) or Bollinger Band width. Higher volatility implies a greater range between the upper and lower bounds of price fluctuation. In contrast, low volatility suggests that price movements are more muted.
In the context of zones of support, high volatility can lead to choppy price action, making it challenging for traders to enter or exit positions with accuracy. On the other hand, low volatility can make it easier for traders to identify clear levels of support and potential entry/exit points.
Traders must closely monitor volatility when identifying and entering trades within zones of support. High volatility can lead to sudden price movements that may result in profit or loss. In contrast, low volatility can indicate a potential trend reversal or consolidation.
To manage volatility risk in a zone of support, traders can employ several strategies:
1. Utilize stop-loss orders: A stop-loss order is an instruction given to a broker to sell (or buy) a security once the market price reaches a specified level. This tool helps manage potential losses and protect profits by automatically executing trades at predetermined prices.
2. Employ risk management techniques: Proper risk management involves assessing the amount of capital allocated for trading, determining position sizing, and setting realistic profit targets while monitoring volatility levels in a zone of support.
3. Use technical analysis tools: Technical indicators like Bollinger Bands, Moving Averages, or other volatility-based indicators can help traders measure and manage volatility within zones of support. By closely watching these indicators, traders can better anticipate price movements and adjust their strategies accordingly.
4. Implement proper position sizing: Properly managing the size of positions in a volatile zone of support is crucial for limiting risk and maximizing gains. Utilizing appropriate position sizing ensures that traders can effectively manage their risk exposure while maintaining profitability in both bullish and bearish markets.
By understanding the role of volatility within zones of support, traders can make more informed decisions on entry/exit points and manage risk more effectively. This knowledge can help increase the probability of success in trading opportunities and ultimately lead to better overall performance.
Example: Identifying Zones of Support in Campbell Soup Company (CPB)
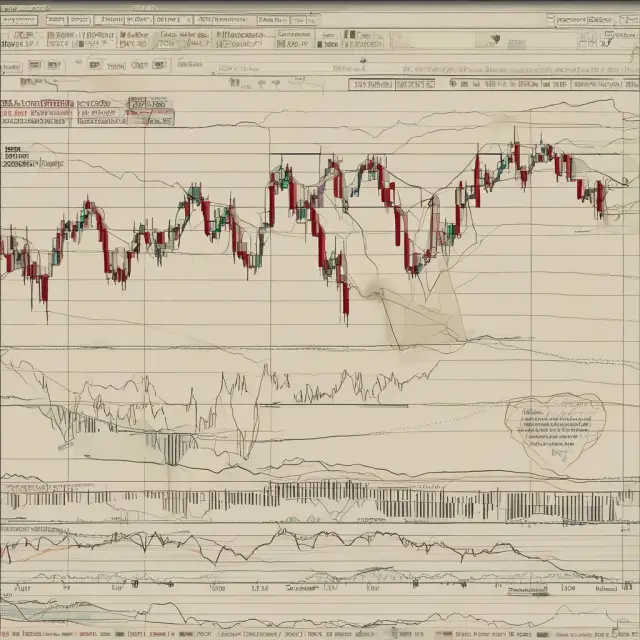
The zone of support plays a crucial role for traders looking to capitalize on potential reversal points or continuation trends. To better understand how this concept functions, let us delve into a real-world example by examining the price chart for the Campbell Soup Company (CPB). By applying key technical analysis tools and trendlines, we will unravel valuable insights on zones of support and their importance to traders.
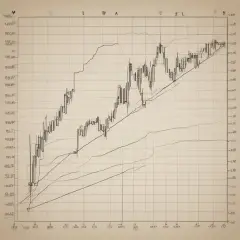
The CPB chart in Figure 1 displays two horizontal trendlines drawn around significant peaks and troughs over the past twelve months. These lines help define the zones of support, providing high probability areas for potential reversals or downside continuation. The two lines connect at a key price range between $26.50 to $27.50.
Support Zones with Envelope Channels
Envelope channels like Bollinger Bands® are popular technical analysis tools used to identify zones of support and resistance. They draw trendlines two standard deviations above and below a security’s moving average, which can help traders quickly pinpoint significant price swings. Figure 2 illustrates the application of Bollinger Bands on the CPB chart, with support levels indicated at the lower band.
Support Zones using Fibonacci Retracement
Another technique for identifying zones of support is through the use of Fibonacci retracement. This methodology calculates potential resistance and support levels based on percentages from significant price swings, making it a valuable tool to help traders identify high probability areas for entries or exits. Figure 3 depicts the application of Fibonacci retracements on the CPB chart, highlighting the key support zones at 23.6%, 38.2%, and 50% percentages.
By combining these technical analysis tools with careful consideration of price action and market sentiment, traders can make informed decisions when entering or exiting positions within the zones of support. These high probability areas offer valuable opportunities for profitable trading, as the increased interest from market participants makes them essential points to monitor closely.

FAQs about Zones of Support
Traders and investors are constantly seeking ways to optimize their investments and capitalize on price movements in the financial markets. One popular strategy is to identify zones of support, which can provide valuable insight into potential reversals or continuation of trends in a security’s price movement. In this section, we address common questions surrounding zones of support and their significance in finance and investment.
What Is a Zone of Support?
A zone of support is an essential concept within technical analysis that refers to a lower boundary where a security’s price has not previously broken through. It presents opportunities for traders to enter or exit positions based on the potential reversal or downside continuation. A zone of support can provide high probability areas for profitable trades, offering valuable insight into the security’s price trend.
How Do I Identify a Zone of Support?
Traders typically use technical analysis techniques such as envelope channels and horizontal trendlines to identify zones of support. Envelope channels like Bollinger Bands®, Keltner Channels, and Donchian Channels help draw continuous support and resistance boundaries around a security’s moving price. Horizontal trendlines, which can be drawn above significant peaks and below troughs, can also highlight areas of potential support.
What Is the Role of Volatility in Support Zones?
Volatility is an important factor to consider within support zones. While zones of support represent areas where price lows have not easily broken through, market pricing mechanisms and trader behavior in these zones can be volatile. Advanced charting software can help traders identify trading indicators within support zones, enabling them to make more informed decisions about their positions.
Can Zones of Support Be Subjective?
Support zones can indeed be subjective and depend on the interpretation of trendlines drawn by individual traders. The strength of support signals in these zones can vary based on factors such as historical price action, volume levels, and overall market conditions. However, these areas can offer valuable insights into potential reversals or continuation of trends, making them essential for traders to monitor closely.
How Do Zones of Support Differ from Resistance Zones?
While zones of support and resistance have similarities in terms of their function as boundaries within a security’s price movement, there are crucial differences between the two. A zone of support represents a lower boundary where the price has not previously broken through, while a zone of resistance is an upper boundary where the price has not easily moved above. Understanding these differences can help traders develop more effective strategies for capitalizing on opportunities within financial markets.
How Do I Use Zones of Support Effectively?
To use zones of support effectively, traders must be aware of their potential implications and learn to interpret price action within these areas. Monitoring volume levels, analyzing historical price patterns, and considering the overall market conditions can help traders make more informed decisions about entering or exiting positions in support zones.
Can Zones of Support Be Reliable?
The reliability of zones of support depends on various factors, such as historical price action, volatility, and overall market conditions. While no strategy is foolproof, identifying zones of support can provide valuable insights into potential reversals or continuation of trends, making them an essential aspect of technical analysis for traders and investors alike.
Are Support Zones Always Accurate?
Support zones are not always accurate, as price movements in financial markets can be influenced by various factors beyond the control of individual traders. However, by closely monitoring support zone activity and considering multiple indicators, traders can increase their chances of making profitable trades within these areas.
Can I Use Different Technical Indicators to Identify Support Zones?
Yes! Traders can use various technical indicators in conjunction with zones of support to enhance their analysis and potentially identify more accurate trading opportunities. Fibonacci retracement, moving averages, and pivot points are just a few popular indicators that can be used in conjunction with support zones to help traders make informed decisions about entry or exit points within these areas.
Can I Use Zones of Support for Long-Term Investing?
Absolutely! While zones of support are often associated with short-term trading strategies, they can also be valuable for long-term investors seeking to capitalize on trends and identify potential opportunities in the market. By closely monitoring support zone activity and considering various factors such as historical price patterns and overall market conditions, long-term investors can use zones of support as a guide for making more informed investment decisions.
Can I Use Zones of Support for Intraday Trading?
Yes! Support zones are an essential concept for intraday traders seeking to capitalize on short-term price movements within a security. By closely monitoring support zone activity, intraday traders can make informed decisions about entering or exiting positions based on potential reversals or continuation of trends within these areas. Additionally, using indicators such as moving averages and pivot points in conjunction with support zones can help intraday traders maximize their chances of making profitable trades throughout the trading day.
In conclusion, zones of support are an essential concept for traders and investors seeking to capitalize on price movements within financial markets. By closely monitoring these areas and considering factors such as historical price patterns, volume levels, and overall market conditions, traders can make more informed decisions about entering or exiting positions based on potential reversals or continuation of trends. Remember that while zones of support are not foolproof, they offer valuable insights into the underlying dynamics of a security’s price movement, making them an essential tool for both short-term and long-term strategies.
 Next entry · No. 5,924Understanding the Zone of Possible Agreement (ZOPA) in Negotiations: Bridging the Gap Between Parties
See also
-
 No. 4,853
22 Jul 2025
20 min
Understanding Tape Reading: Analyzing Stock Prices and Volume Through Time
Business Finance
No. 4,853
22 Jul 2025
20 min
Understanding Tape Reading: Analyzing Stock Prices and Volume Through Time
Business Finance -
 No. 1,297
26 Aug 2024
19 min
Understanding Envelopes in Technical Analysis: Identifying Trading Opportunities with Moving Average Envelopes
Financial Tools
No. 1,297
26 Aug 2024
19 min
Understanding Envelopes in Technical Analysis: Identifying Trading Opportunities with Moving Average Envelopes
Financial Tools -
 No. 5,765
06 Oct 2025
20 min
A Comprehensive Guide to Withdrawal Plans: Income Streams for Professional and Institutional Investors
Investments
No. 5,765
06 Oct 2025
20 min
A Comprehensive Guide to Withdrawal Plans: Income Streams for Professional and Institutional Investors
Investments -
 No. 5,418
07 Sep 2025
19 min
Value Averaging vs Dollar Cost Averaging: Which Investment Strategy Is Right for You?
Investments
No. 5,418
07 Sep 2025
19 min
Value Averaging vs Dollar Cost Averaging: Which Investment Strategy Is Right for You?
Investments -
 No. 5,367
02 Sep 2025
20 min
Understanding U.S. Savings Bonds: A Safe Investment Option for Institutional Investors
Investments
No. 5,367
02 Sep 2025
20 min
Understanding U.S. Savings Bonds: A Safe Investment Option for Institutional Investors
Investments -
 No. 5,012
04 Aug 2025
20 min
Understanding Total Return Index: A Comprehensive Guide to Capital Appreciation and Cash Distributions
Investments
No. 5,012
04 Aug 2025
20 min
Understanding Total Return Index: A Comprehensive Guide to Capital Appreciation and Cash Distributions
Investments