Understanding Average Daily Trading Volume (ADTV): Importance, Calculation, and Interpretation for Institutional Investors

Average daily trading volume (ADTV) is the average number of shares of a security traded per day over a set look-back period, a standard gauge of liquidity. SEC Rule 10b-18, for example, measures it over the four calendar weeks before a buyback and limits safe-harbor repurchases to 25% of it per day.
Definition and Significance of Average Daily Trading Volume (ADTV)
Average daily trading volume (ADTV), also known as the average daily volume or average volume, represents the mean number of shares transacted each day in a particular stock over an extended period. In essence, ADTV is calculated by averaging out the daily trading volumes for a specific security over several days or weeks.
The importance of understanding ADTV comes from its significant role in evaluating market liquidity and identifying potential trends and price movements in securities. Market liquidity refers to the ease with which securities can be bought and sold without significantly impacting their price, making it an essential metric for institutional investors.
High trading volumes generally indicate greater competition among buyers and sellers, leading to narrower spreads and less volatility. Conversely, low trading volumes can make it more challenging for traders to enter or exit positions due to the limited number of available buyers and sellers. This information is vital for institutional investors looking to execute large trades as they require sufficient liquidity to minimize market impact and transaction costs.
When ADTV experiences significant increases or decreases, it often signifies a notable shift in investor sentiment towards a particular security. These changes may be bullish or bearish depending on the price direction. For instance, an increase in ADTV could indicate that a stock is gaining increasing attention and interest from investors, leading to potential price appreciation. Alternatively, decreasing ADTV might suggest that investor interest is waning, potentially indicating a downturn in the stock’s performance.
By understanding the significance of average daily trading volume, institutional investors can make more informed decisions regarding position sizing, risk management, and entry/exit strategies. For example, high trading volumes may indicate favorable conditions for entering a new position, as the liquidity makes it easier to buy or sell shares without significantly affecting their price. In contrast, low trading volumes might suggest that it’s best to avoid taking large positions in a particular stock until volume picks up again, potentially indicating a more significant price move or trend reversal.
In conclusion, average daily trading volume is an essential metric for understanding market liquidity and investor sentiment, providing valuable insights for institutional investors looking to make well-informed decisions in their financial endeavors.

Calculating Average Daily Trading Volume (ADTV)
Understanding the concept of average daily trading volume (ADTV) is crucial for investors and traders in various financial markets. ADTV represents the average number of shares or contracts traded within a specific time period, typically calculated over several days. The calculation of ADTV sheds light on the overall liquidity and trading activity within a security, providing valuable insights into market sentiment and price action.
To calculate daily trading volume, you add up the total number of shares or contracts traded each day for a specified time frame. For instance, daily trading volume can be calculated by adding the number of shares traded during one trading day and dividing it by 21 to get the average daily volume over a 21-day period.
A higher ADTV indicates that the security is more competitive in terms of liquidity, with narrower spreads and less volatility. Conversely, a lower ADTV suggests reduced market activity and potentially larger transaction costs due to wider spreads.
The significance of average daily trading volume extends beyond just liquidity evaluation. It can also serve as an indicator of potential price movements. For example:
- When average daily trading volume increases significantly, it signifies a shift in investor sentiment or interest towards the asset, possibly due to new information or events. This change could be bullish or bearish, depending on the direction of the price trend.
- A declining average daily trading volume might suggest waning interest in the security, which could potentially result in lower liquidity and higher transaction costs. However, even a decreasing ADTV can prove useful as an indicator of potential reversals when it starts to rebound again.
- Large increases or decreases in daily trading volume, particularly compared to historical averages, may impact price action by causing trend breaks, confirming breakouts, or initiating price reversals.
By understanding the importance and role of average daily trading volume, investors and traders can make more informed decisions regarding position sizing, risk management, entry/exit strategies, and overall market timing. Keep in mind that it is essential to monitor and analyze ADTV in conjunction with other technical and fundamental indicators for a comprehensive view of a security’s health.
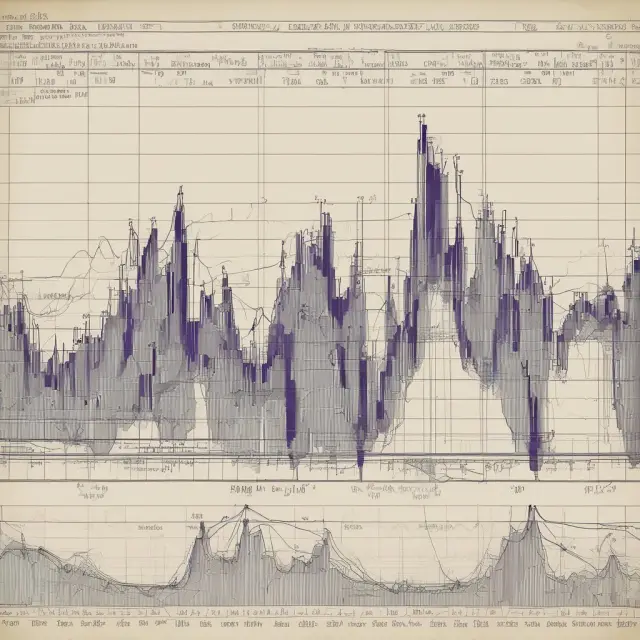
Interpreting ADTV: Indicators of Market Liquidity, Price Action, and Volume Spikes
Understanding the Implications of Average Daily Trading Volume (ADTV)
Average daily trading volume is a significant indicator in finance and investment that gives insight into market liquidity, price action, and potential volume spikes. When interpreting ADTV, it’s essential to recognize its meaning and implications for investors and traders.
Market Liquidity: Market liquidity refers to the ease with which an asset can be bought or sold without significantly impacting the market price. Higher trading volumes indicate greater market liquidity as there are more buyers and sellers actively participating in the market, reducing the potential price impact of large trades. In contrast, low trading volumes suggest limited liquidity, making it harder for investors to execute their desired transactions at favorable prices.
Price Action: Interpreting ADTV is critical when evaluating price action because it can help confirm or invalidate trends and patterns. For instance, during a strong uptrend, increasing volume indicates the presence of buyers who are supporting the upward price movement. Conversely, decreasing volume may signal that buying interest is waning, potentially indicating a trend reversal.
Volume Spikes: Volume spikes are significant price movements accompanied by high trading volumes. They can be caused by various factors such as news releases, earnings reports, or regulatory announcements. Investors must consider ADTV when observing volume spikes to determine their potential impact on the market. A surge in volume with a strong directional move suggests that the trend is likely to continue, while a lack of follow-through volume may indicate a false breakout.
Analyzing Average Daily Trading Volume: Insights and Best Practices
To effectively interpret ADTV, traders and investors should understand how to calculate it and use it in conjunction with other technical indicators. A few key practices include:
- Comparing current volume levels to historical averages: Monitoring the difference between recent volume and long-term ADTV can help identify trend reversals or potential opportunities for entry or exit.
- Assessing volume trends: Evaluate whether volume is increasing, decreasing, or remaining constant in relation to price movements. This information can provide insight into the strength of a trend.
- Combining ADTV with other technical indicators: Utilize moving averages, support and resistance levels, and RSI (Relative Strength Index) to confirm trends and identify potential entry and exit points.
- Considering volume in conjunction with fundamental analysis: Use volume data alongside company news, financial statements, and industry reports to gain a more comprehensive understanding of market sentiment and stock performance.
- Identifying and analyzing volume spikes: Carefully evaluate the cause and implications of volume spikes by considering potential catalysts and their impact on market dynamics.
By following these best practices, traders and investors can effectively integrate ADTV into their analysis, enabling them to make informed decisions based on accurate information and valuable insights.

ADTV vs. Open Interest Volume: Differences and Comparison for Institutional Investors
Average daily trading volume (ADTV) and open interest volume are two commonly used concepts in the financial markets, each representing distinct aspects of market activity. It is essential to differentiate between ADTV and open interest volume when analyzing investment strategies and making informed decisions as an institutional investor.
Daily Trading Volume: Measuring the Shares or Contracts Changing Hands
Average daily trading volume (ADTV) is a measure of how many shares or contracts change hands within a day for a specific security, averaged over a predefined period. Intraday volume refers to the volume traded during a single trading session. To calculate ADTV, you need to add up the total volume over a certain time frame (e.g., 20 days) and then divide it by the number of days in that period:
ADTV = Total Daily Volume / Number of Days
For example, if a stock has traded 500,000 shares on each of the last 10 trading days, the ADTV would be calculated as follows:
ADTV = (500,000 x 10) / 10 = 5,000,000
Open Interest Volume: Understanding the Number of Contracts Remaining Open
Open interest volume refers to the total number of contracts that have not been closed within a derivatives market. It represents the current balance of buy and sell positions in futures, options, or swaps markets. In other words, it measures the extent of underlying market participants’ commitment to specific prices at any given time. Open interest is typically reported daily and is an essential measure for analyzing the liquidity and potential price impact of a particular financial instrument.
Interpreting the Differences Between ADTV and Open Interest Volume
Both ADTV and open interest volume play crucial roles in understanding market activity, but it is essential to recognize their unique characteristics and implications:
- Timing: ADTV measures the volume traded during a specific day or days, while open interest volume represents the total number of contracts still outstanding in the market at any given moment.
- Market Liquidity: High ADTV indicates a high level of trading activity and liquidity, making it easier for investors to enter and exit positions quickly. In contrast, open interest volume reveals the underlying depth of the market, providing insights into potential buyers and sellers that may be looking to trade at specific price points.
- Market Sentiment: A sudden shift in ADTV can signal a change in investor sentiment towards a particular asset, potentially affecting its short-term price movements. Open interest volume can provide valuable context by helping investors understand the underlying reasons behind such shifts in sentiment and assess potential future price trends.
- Trading Strategies: Understanding both ADTV and open interest volume allows institutional investors to formulate more informed trading strategies, such as determining optimal entry and exit points based on liquidity and market depth considerations.
In conclusion, while average daily trading volume (ADTV) and open interest volume are related concepts, it is essential for institutional investors to recognize their differences and the unique insights they offer when analyzing investment opportunities. By staying informed about both metrics, investors can make more informed decisions and better navigate financial markets.

Using ADTV in Technical Analysis: Trends, Breakouts, and Price Reversals
Average daily trading volume (ADTV) plays a vital role in technical analysis as an indicator of market sentiment, liquidity, and price direction. By studying trends, breakouts, and price reversals, traders and investors can make informed decisions based on the patterns revealed by ADTV. Let’s dive deeper into these aspects to understand how average daily trading volume functions in technical analysis:
Trends:
When analyzing trends using ADTV, there are a few key things to look for. First, observe the overall trend of the ADTV itself. If the volume is consistently increasing during an uptrend or decreasing during a downtrend, it confirms that the price movement is genuine and likely to continue. On the other hand, if volume is inconsistent with the price direction, it could indicate that the trend may reverse.
Breakouts:
ADTV comes into play when studying breakouts, which occur when an asset’s price breaks out of a range or resistance/support level. When this happens, increased volume often accompanies the breakout, helping to confirm its validity and signaling the potential for further price movement in that direction. Conversely, a lack of volume during a breakout could indicate that the move might not be sustainable, as there may not be enough market interest to support it.
Price Reversals
ADTV is also an essential tool when identifying price reversals. A significant increase or decrease in volume can often precede a price reversal, providing valuable insight into potential shifts in market sentiment and direction. For example, a sharp increase in volume during an uptrend may suggest that the trend is approaching an exhaustion point and could soon reverse. On the other hand, decreased volume during a downtrend might indicate that selling pressure is waning, potentially setting the stage for a reversal to the upside.
By closely monitoring average daily trading volume in conjunction with price trends, breakouts, and reversals, traders and investors can improve their decision-making process and enhance their overall market analysis capabilities. The next section will explore the limitations of using ADTV to help provide a more complete understanding of its applicability in financial analysis.

Limitations of Using Average Daily Trading Volume (ADTV)
While average daily trading volume (ADTV) offers valuable insights for traders and investors, it comes with its own limitations. This section discusses these limitations and their implications on investment decisions.
1. Inaccurate Representation: ADTV may not accurately represent the true liquidity of a security due to varying daily volumes. Volatility, news events, or institutional block trades can significantly impact daily volume without affecting the underlying demand for the stock. Consequently, investors might misjudge the actual trading activity and liquidity of a security based on its average daily trading volume alone.
2. Time-bound: The time frame used to calculate ADTV influences its usefulness in investment analysis. Short-term averages (e.g., 5 or 20 days) may not accurately reflect the long-term trend, while long-term averages might not provide sufficient information for timely decision making. Investors need to consider a combination of short-term and long-term ADTV to gain a comprehensive understanding of trading activity in a stock.
3. Market Manipulation: Artificially increasing or decreasing trading volume through market manipulation techniques can skew the ADTV data. For instance, insider trading, pump-and-dump schemes, or short-selling may lead to high or low volume days that do not represent the intrinsic value of the security, making it crucial for investors to verify and cross-check the reported volume data.
4. Market Fragmentation: With the increasing complexity in financial markets and the proliferation of alternative trading systems (ATS), dark pools, and other off-exchange venues, calculating a single ADTV might not reflect the actual liquidity of a security across all marketplaces. This fragmented trading environment necessitates the use of multiple volume measures from various sources for a more accurate assessment of market depth.
5. Volume Spikes: While sudden volume spikes can provide valuable information on emerging trends, they may also be short-lived and lack follow-through. Investors must carefully analyze the reasons behind these volume spikes and their potential impact on the stock’s price trend before making investment decisions based on them.
In conclusion, average daily trading volume is a powerful tool in financial analysis, but investors need to understand its limitations and use it in conjunction with other quantitative and qualitative measures to make informed investment decisions. By acknowledging these limitations, investors can effectively incorporate ADTV into their overall trading strategy to capitalize on opportunities and mitigate risks.

Case Study: Interpreting ADTV and Price Action in a Hypothetical Stock
Understanding the practical application of Average Daily Trading Volume (ADTV) and its implications on price action requires a real-life example. Let us analyze a hypothetical stock, XYZ Inc., to explore how volume data impacts market liquidity and price movements.
XYZ Inc. is an emerging tech company that recently went public. In the initial few weeks of trading, the daily trading volume was irregular, ranging from 50,000 shares up to 250,000 shares. This inconsistency indicates a lack of established market interest and liquidity, resulting in wider spreads and volatile price swings.
As traders and investors gained confidence in XYZ Inc.’s underlying fundamentals, daily trading volume began increasing steadily over the following months. The average daily trading volume (ADTV) for XYZ Inc. rose from 100,000 shares to an impressive 350,000 shares during this period. This increase in ADTV indicates that more buyers and sellers are participating in the market, making it easier to execute trades at competitive prices.
One significant price movement occurred when XYZ Inc. announced a new partnership with a leading industry player, causing its stock price to surge by 20% within a day. The increased volume during this event was substantial and indicated that institutional investors had recognized the significance of the news, leading them to buy large quantities of XYZ’s shares.
However, following this major price increase, XYZ’s stock price started to consolidate with lower daily trading volume. Although the average daily trading volume did not decline significantly during the consolidation phase, it is essential to note that lower volume implies decreased investor interest and potential for smaller trades. If a sudden sharp price movement occurs without an increase in volume, it could signal a lack of conviction from traders and investors.
In summary, the analysis of XYZ Inc.’s hypothetical trading data demonstrates how ADTV influences market liquidity and price movements. An increasing average daily trading volume indicates growing interest and participation among investors, resulting in easier trade execution at competitive prices. Conversely, decreasing or inconsistent volume may suggest a lack of conviction and potentially unfavorable price movements.

Implications for Institutional Investors: Position Sizing, Risk Management, and Entry/Exit Strategies
Institutional investors play a critical role in the financial markets by managing large pools of capital and influencing market trends through their trading activities. One key metric that institutional investors often analyze to inform their investment strategies is average daily trading volume (ADTV). In this section, we discuss how institutional investors can utilize average daily trading volume for effective position sizing, risk management, and entry/exit strategies.
Position Sizing
When considering the size of an investment position, institutional investors need to assess whether a security has enough liquidity to execute their desired trade size without significantly impacting the market price. High average daily trading volumes indicate that there are ample buyers and sellers in the market, making it easier for institutional investors to enter or exit positions without moving the market price excessively. Conversely, low average daily trading volumes can pose a challenge for large trades as they may require more time and resources to find counterparties and execute trades without disturbing the market. By understanding the liquidity provided by a security’s ADTV, institutional investors can confidently determine the size of their positions based on both the available market depth and their risk tolerance.
Risk Management
Effective risk management is essential for institutional investors, as they are responsible for managing large capital pools that can significantly influence market trends. Average daily trading volume (ADTV) plays a role in assessing potential risks associated with entering or exiting positions. High ADTV signals that the security is more liquid and less volatile, reducing the risk of widening spreads and larger price swings when implementing trades. On the other hand, low average daily trading volumes can lead to increased market impact as larger orders may cause price fluctuations, potentially resulting in losses if the timing or execution is not optimal. By closely monitoring ADTV, institutional investors can make informed decisions on their entry/exit strategies and minimize potential risks stemming from poor liquidity conditions.
Entry/Exit Strategies
Average daily trading volume (ADTV) also plays a crucial role when determining the optimal entry and exit points for institutional trades. High ADTV during trending price movements can help confirm the strength of the trend while ensuring sufficient liquidity to enter or exit positions with minimal impact on market prices. For example, a stock experiencing a significant uptrend accompanied by increased trading volume indicates strong investor demand, making it an attractive entry point for institutional investors looking to capitalize on the upward price momentum. Conversely, high ADTV during downtrends may indicate a bearish sentiment among investors, providing a potential exit opportunity for institutional investors seeking to minimize losses. By using average daily trading volume as a complementary tool alongside technical analysis and fundamental research, institutional investors can optimize their entry/exit strategies while minimizing market impact and overall risk exposure.
In conclusion, understanding the importance of average daily trading volume (ADTV) in finance and investing is crucial for both individual traders and institutional investors alike. ADTV provides valuable insights into market liquidity, price action, and investor sentiment that can inform investment decisions, improve position sizing, enhance risk management, and optimize entry/exit strategies. By consistently monitoring and analyzing average daily trading volume in various securities, investors can effectively navigate the financial markets with increased confidence and efficiency.

Best Practices for Analyzing Average Daily Trading Volume (ADTV)
Average daily trading volume (ADTV) is a valuable metric in the financial world that provides significant insights into the liquidity and overall health of an investment. By examining the ADTV trends, investors can make informed decisions regarding position sizing, risk management, and entry/exit strategies. Here are some best practices for analyzing average daily trading volume to maximize your investment gains.
1. Understanding Calculation and Interpretation:
Begin by familiarizing yourself with the calculation of ADTV and interpreting its significance in different scenarios. As mentioned earlier, ADTV is calculated as a moving average of daily trading volumes over a specific period, typically 20, 50, or 100 days. Increases in ADTV signify greater interest and liquidity in the stock, while decreases could indicate waning investor sentiment.
2. Comparing ADTV to Open Interest Volume:
It’s essential to distinguish between average daily trading volume and open interest volume when analyzing investment opportunities. While ADTV measures the number of shares traded during a day or over a specific period, open interest volume indicates the total number of contracts that have not been closed yet. Understanding both metrics will provide a comprehensive perspective on market dynamics and liquidity.
3. Utilizing ADTV for Trends and Breakouts:
ADTV plays an important role in confirming trends and identifying potential breakouts. When analyzing uptrends, observe rising volumes as they indicate increasing buying pressure and confirmation of the trend’s strength. Conversely, declining volume during downtrends could suggest a reversal or weakened momentum.
4. Volume Spikes and Reversals:
Volume spikes in either direction can be crucial indicators for potential price reversals, entry/exit points, or market sentiment shifts. For example, sudden and significant volume increases may indicate buying interest, while sharp declines might suggest selling pressure. Keep a close eye on these events to adjust your investment strategy accordingly.
5. Monitoring Liquidity:
By tracking average daily trading volume, investors can assess the liquidity of an asset. High ADTV generally indicates better liquidity and lower transaction costs, making it easier to execute trades quickly and efficiently. Conversely, low ADTV might indicate limited market depth, increased slippage, and longer execution times.
6. Volume Analysis in Technical Charts:
Technical charts can be used to visualize the relationship between price action and average daily trading volume. By analyzing the trends, patterns, and correlations between these two elements, investors can gain valuable insights into market movements, potential entry/exit points, and risk management strategies.
7. Regularly Reviewing ADTV:
Last but not least, it’s crucial to frequently review average daily trading volume data for your investments. As market conditions and investor sentiment change, so might the volume trends that influence liquidity and price movements. Adjusting your investment strategy based on real-time market analysis can help ensure optimal results.
By following these best practices when analyzing average daily trading volume, investors can make informed decisions backed by data and trends, ultimately leading to better investment outcomes.

FAQ: Frequently Asked Questions about Average Daily Trading Volume (ADTV)
Average daily trading volume (ADTV) is a crucial metric for traders and investors in understanding the liquidity, price action, and overall health of an asset. ADTV represents the average number of shares traded per day over a specified period. This section will answer common questions related to calculating, interpreting, and using average daily trading volume effectively.
**What is Average Daily Trading Volume (ADTV)?**
ADTV signifies the average number of shares exchanged within a single day in a given stock over a particular time frame. By calculating the daily trading volume for a set period, such as 20 days or 60 days, and averaging it, we obtain the average daily trading volume for that asset.
**Why is ADTV significant?**
ADTV holds importance for investors and traders due to several reasons:
- **Liquidity:** High liquidity assets enable easier and faster transactions with reduced spreads and lower volatility. In contrast, less-liquid securities may result in higher transaction costs and broader spreads. By analyzing ADTV, we can assess a stock’s overall liquidity and its impact on our investment decisions.
- **Price Action:** Understanding ADTV helps us interpret price movements by confirming trends, breakouts, or reversals. Increased volume during a trend could be a favorable entry point or a sign of an imminent price reversal.
- **Market Sentiment:** Monitoring ADTV provides insights into market sentiment and the collective interest of investors towards a particular stock. Large volume spikes can signal shifts in investor perception, helping us make informed decisions.
**How to calculate Average Daily Trading Volume (ADTV)?**
To calculate average daily trading volume for any asset, follow these steps:
- Determine the time frame you want to consider (e.g., 20 days or 60 days).
- Add up the total trading volume during that period.
- Divide the sum by the number of days in that period to obtain the average daily trading volume.
**What does increasing ADTV signify?**
Increasing average daily trading volume may indicate a shift in market sentiment towards the asset, often due to news, earnings reports, or other significant events. This increased interest could be bullish or bearish depending on whether the price is trending upwards or downwards.
**What does decreasing ADTV imply?**
Decreasing average daily trading volume may indicate a decline in investor interest or a potential market consolidation. Low volume can make it more challenging to execute trades, potentially leading to wider spreads and increased price volatility.
**How is ADTV different from Open Interest Volume?**
Although related, ADTV and open interest volume serve distinct purposes:
- **ADTV:** Average daily trading volume measures the average number of shares traded per day over a specified period. It offers insights into current liquidity and market sentiment, helping investors make informed decisions regarding entry or exit strategies.
- **Open Interest Volume:** Open interest refers to the total number of open contracts in a futures market that have not yet been settled. It is used to assess supply and demand dynamics, providing insight into potential future price movements. While useful, open interest volume does not directly relate to the actual trading activity on any given day.
By understanding these differences, investors can leverage both metrics for effective market analysis.
 Next entry · No. 295Understanding Average Life in Finance and Investment: Measuring Risk in Bonds and Mortgage-Backed Securities
See also
-
 No. 221
07 Apr 2024
20 min
Understanding Ascending Triangles: A Technical Analysis Chart Pattern for Institutional Investors
Markets
No. 221
07 Apr 2024
20 min
Understanding Ascending Triangles: A Technical Analysis Chart Pattern for Institutional Investors
Markets -
 No. 650
14 May 2024
20 min
Understanding the CBOE Options Exchange: A Comprehensive Guide for Institutional Investors
Financial Tools
No. 650
14 May 2024
20 min
Understanding the CBOE Options Exchange: A Comprehensive Guide for Institutional Investors
Financial Tools -
 No. 445
24 Apr 2024
20 min
Understanding the Bloomberg Terminal: A Powerful Tool for Institutional Investors
Financial Tools
No. 445
24 Apr 2024
20 min
Understanding the Bloomberg Terminal: A Powerful Tool for Institutional Investors
Financial Tools -
 No. 210
07 Apr 2024
20 min
Understanding the Arms Index (TRIN): An Essential Technical Analysis Tool for Institutional Investors
Financial Tools
No. 210
07 Apr 2024
20 min
Understanding the Arms Index (TRIN): An Essential Technical Analysis Tool for Institutional Investors
Financial Tools -
 No. 144
07 Apr 2024
19 min
Understanding Alternative Trading Systems (ATS): Dark Pools, Regulations, and Market Liquidity
Financial Tools
No. 144
07 Apr 2024
19 min
Understanding Alternative Trading Systems (ATS): Dark Pools, Regulations, and Market Liquidity
Financial Tools -
 No. 714
26 May 2024
18 min
Understanding Commercial Paper: An Unsecured Short-Term Debt Instrument for Institutional Investors
Corporate Finance
No. 714
26 May 2024
18 min
Understanding Commercial Paper: An Unsecured Short-Term Debt Instrument for Institutional Investors
Corporate Finance