Understanding Debt-to-Equity Ratio: Calculation, Interpretation, and Application

Learn the ins and outs of Debt-to-Equity Ratio: calculation, interpretation, application, advantages, limitations, and more!
Introduction to Debt-to-Equity Ratio (D/E)
The debt-to-equity ratio (D/E) is an essential financial metric used to gauge a company’s financial leverage and debt levels. This ratio signifies the proportion of debt to equity financing in a business, calculated by dividing total liabilities by shareholder equity. In corporate finance, the D/E ratio plays a crucial role as it offers valuable insights into a firm’s capacity to meet its obligations, manage risks, and evaluate potential investment opportunities.
Calculation and Interpretation of D/E Ratio:
To determine a company’s debt-to-equity ratio, you need to access its balance sheet data. This financial statement provides the necessary information on total liabilities and shareholder equity. To calculate the D/E ratio, simply divide total liabilities by shareholder equity, as shown in the formula below:
Debt-to-Equity = Total Liabilities / Shareholder Equity
A lower debt-to-equity ratio indicates that a company has less reliance on debt and more on equity financing, while a higher ratio suggests a greater dependence on debt. This information can be helpful to both investors and lenders in understanding the level of financial risk involved.
Significance and Implications:
The D/E ratio is significant because it reveals several key aspects about a company’s financial standing. First, it measures the extent of a firm’s reliance on debt financing versus its own equity resources. Secondly, it offers insights into the company’s credit risk profile, as a higher D/E ratio often implies greater leverage and potential financial vulnerability. Moreover, the D/E ratio can inform equity holders about the impact of borrowing on their ownership stakes and the potential dilution effect from additional debt issuances.
Comparing Industry D/E Ratios:
It’s essential to consider industry norms when evaluating a company’s debt-to-equity ratio, as different industries have varying capital requirements and growth rates. By comparing D/E ratios among competitors within the same sector, investors can effectively determine whether a company’s financial leverage is in line with industry averages or represents an outlier that could impact its valuation or profitability.
Understanding Short-Term vs Long-Term Debt:
When analyzing a firm’s debt structure, it’s crucial to distinguish between short-term and long-term debt. While both types contribute to the D/E ratio, their implications differ significantly. Short-term debt usually entails obligations that need repayment within one year, while long-term debt refers to borrowing with a maturity longer than a year. Understanding this distinction is essential when evaluating the overall financial health and risk profile of a company.
Investor Perspectives:
Institutional investors use D/E ratios to assess a corporation’s creditworthiness, evaluate potential investment opportunities, and monitor changes in debt levels over time. By analyzing trends and comparing industry benchmarks, investors can identify companies with favorable risk-reward profiles and make informed decisions based on sound financial data.

Calculating D/E Ratio
The debt-to-equity (D/E) ratio is an essential financial metric used to assess a company’s financial leverage. This ratio measures the extent of a company’s reliance on debt financing versus shareholder equity. To calculate the D/E ratio, we divide a company’s total liabilities by its shareholders’ equity. The formula for this ratio is simple:
Debt-to-Equity = Total Shareholders’ Equity / Total Liabilities
To obtain these figures, investors and analysts often refer to a listed company’s balance sheet. The balance sheet provides the required data to calculate the D/E ratio by revealing the distinction between total assets, liabilities, and shareholder equity. Let’s take a closer look at this calculation process:
1. Locate a company’s balance sheet and find the values for total shareholders’ equity and total liabilities. Remember that these figures are typically listed under the respective headings on the balance sheet. For instance, Apple Inc.’s (AAPL) 2017 10-K statement reveals the following data:
Total Liabilities = $241 billion
Total Shareholders’ Equity = $134 billion
2. Divide total shareholders’ equity by total liabilities to get the D/E ratio:
Debt-to-Equity = $134,000,000 / $241,000,000 = 0.56 (or a 56% debt-to-equity ratio)
The result of this calculation implies that Apple had $0.56 of debt for every dollar of equity in 2017. This figure can be compared with industry benchmarks or historical data to assess the company’s financial position effectively.
However, it’s important to note that some items on a balance sheet may not represent typical forms of debt or equity. The D/E ratio can be influenced by factors such as retained earnings, intangible assets, and pension plan adjustments. To obtain a clearer picture, analysts and investors often modify the D/E ratio. They might also consider short-term leverage ratios like cash ratio and current ratio to evaluate a company’s short-term solvency and its ability to meet debt obligations within a year or less.
In conclusion, calculating the D/E ratio is an essential step in evaluating a company’s financial position and assessing its reliance on debt financing versus shareholder equity. By understanding this key metric, investors can make more informed decisions regarding potential investments and risk management strategies.

Importance of D/E Ratio
Understanding a company’s debt-to-equity (D/E) ratio is crucial as it provides insights into the financial structure and risk profile. This vital metric measures the level of debt financing versus equity financing in a company’s capital structure. The debt-to-equity ratio is calculated by dividing a firm’s total liabilities by its shareholder equity. A higher D/E ratio implies that a larger portion of a company’s assets is financed through debt, while a lower one means more reliance on equity.
Financial leverage can be beneficial if it increases earnings and generates more profits than the cost of borrowing. However, high levels of debt can lead to increased financial risk since interest expenses must be paid regardless of profitability. Additionally, should a company face difficulty in meeting its obligations, shareholders could bear the brunt of any negative consequences, such as dilution or bankruptcy.
The D/E ratio is an essential tool for both investors and creditors when evaluating a company’s ability to meet its financial obligations. For institutional investors, it can help assess credit risk and identify potential investment opportunities. Debt financing allows companies to expand operations, invest in research and development, or make strategic acquisitions without diluting equity ownership.
However, it is essential to interpret the D/E ratio within the context of an industry, as different industries have varying capital requirements and growth rates. For instance, highly regulated industries may require significant debt financing due to their high initial investment costs. Conversely, a technology company might choose to raise funds through equity issuances, as they tend to be more volatile and need access to capital for continuous innovation and development.
Comparing D/E ratios between companies within the same industry can offer valuable insights into relative risk profiles. A higher ratio may suggest increased financial risk, while a particularly low one could indicate that the company is not fully utilizing debt financing opportunities. Additionally, monitoring changes in a firm’s D/E ratio over time can reveal trends and provide insight into the company’s strategic focus on debt or equity financing.
By analyzing long-term debt versus short-term debt within a company’s capital structure, investors can better understand their exposure to interest rate risk and potential liquidity concerns. This modification to the standard D/E ratio helps assess the degree of financial leverage derived from long-term borrowing, which generally carries more risk due to its extended repayment terms.
Lastly, D/E ratio plays a vital role in personal finance as well. It can help individuals evaluate their ability to meet debt obligations and secure loans, offering a clearer understanding of their financial situation. This concept can be particularly useful when applying for mortgages or business loans, enabling applicants to showcase their financial stability and strength.

Differences Between Short-Term and Long-Term Debt
Understanding debt is crucial when assessing a company’s financial position. Debt comes in two main flavors: short term and long term, which significantly impact the calculation and interpretation of the debt-to-equity (D/E) ratio. Let us delve deeper into their differences.
Short-term debts refer to obligations that must be repaid within one year or a fiscal period, while long-term debts include those due beyond a year. Debt maturities vary broadly from short-term commercial paper to long-term bonds. Both types of debt affect the D/E ratio, albeit differently.
Short-Term Debt Impact on D/E Ratio
The impact of short-term debt on the D/E ratio is generally smaller due to its relatively lower magnitude compared to long-term debt. As a result, modifying the standard D/E ratio to account for only long-term debts can provide a more accurate perspective of a company’s reliance on long-term financing and risk profile.
Long-Term Debt Impact on D/E Ratio
Long-term debts, however, carry more financial leverage and risks than short-term obligations since they require regular interest payments and have extended maturities. Incorporating only long-term debt in the D/E ratio calculation provides a clearer understanding of a company’s overall gearing or leverage level.
Comparing Short-Term and Long-Term Debt
It is essential to evaluate both short-term and long-term debts while assessing a company’s financial health since each has unique characteristics and implications. Short-term debt tends to be cheaper than long-term debt due to lower interest rates, but it is more flexible because of its shorter maturity. In contrast, long-term debt comes with fixed interest payments over an extended period, making the financing cost predictable for investors. However, the potential downside of long-term debts is their greater sensitivity to changes in market conditions, especially during periods of high inflation or rising interest rates.
Conclusion:
Understanding short-term and long-term debt’s role in calculating D/E ratios is crucial when analyzing a company’s financial position and assessing its ability to meet debt obligations. By focusing on long-term debt, investors can gain deeper insights into a firm’s reliance on debt financing and evaluate the potential risks associated with its capital structure.

Comparing Industry D/E Ratios
Understanding Debt-to-Equity Ratios (D/E) is crucial for investors and analysts as it provides valuable insights into a company’s financial leverage and risk profile. However, to fully comprehend a company’s debt position, it’s essential to compare its D/E ratio with those of competitors within the same industry and assess any changes over time.
Industries Differ in Capital Intensities
Every industry requires varying levels of capital to operate effectively, which is why comparing a tech firm’s D/E ratio with that of an agricultural company would not yield meaningful insights. For instance, a capital-intensive industry like utilities or manufacturing typically has higher debt levels due to the significant expenses involved in purchasing and maintaining assets compared to more labor-intensive industries like retail or services.
Benefits of Industry Comparisons
Comparing D/E ratios within an industry enables investors to identify trends, assess risk levels, and evaluate a company’s competitive standing. A higher D/E ratio than competitors could indicate increased financial risk, while a lower one might suggest an underutilization of debt financing for growth opportunities.
Assessing Changes Over Time
Comparing a company’s historical D/E ratios can help investors determine whether a company is taking on more or less debt over time. A rising D/E ratio may imply increased financial risk, while a declining one might signify improved financial health and reduced reliance on debt financing.
Implications for Institutional Investors
Institutional investors often compare industry D/E ratios to assess the creditworthiness of potential investments. High debt levels could impact a company’s ability to meet interest payments, potentially leading to a downgrade in its credit rating and affecting investment decisions.
In conclusion, understanding Debt-to-Equity Ratios is crucial for investors and analysts. However, to fully evaluate a company’s financial position, it’s vital to compare its D/E ratio with industry averages and monitor changes over time. By doing so, you can make more informed investment decisions and gain a better understanding of the risk involved in different industries.

Modifications to D/E Ratio
While calculating the standard debt-to-equity (D/E) ratio is an essential step to understanding a company’s leverage position, investors and analysts often find it necessary to modify this financial ratio. Modifying the D/E ratio provides insights into various aspects of a company’s financial situation that might not be apparent from the standard ratio alone. Two common modifications of the D/E ratio are long-term debt ratios: long-term debt-to-equity (LTDE) and gearing ratios.
Long-Term Debt Ratios
Long-term debt is an essential component when evaluating a company’s financial leverage, as it represents a more significant risk to equity holders than short-term debt. Long-term debt typically has a longer payment duration and a higher interest rate compared to short-term debt, making its impact on the company’s capital structure more substantial. Consequently, investors often focus on long-term debt when assessing a company’s leverage position.
Long-Term Debt-to-Equity Ratio (LTDE)
LTDE ratio is calculated by dividing a company’s total long-term debt by its shareholder equity: LTDE ratio = Long-term debt ÷ Shareholder equity
LTDE is often preferred over the standard D/E ratio since it only considers long-term obligations, providing a clearer indication of a company’s reliance on long-term borrowing. Moreover, LTDE can help investors compare companies within the same industry more accurately, as industries may have different requirements for short-term and long-term debt.
Gearing Ratio
Another commonly used modification to D/E ratio is gearing ratio. Gearing or leverage ratio measures the proportion of a company’s assets that is financed by debt rather than equity. The gearing ratio is calculated as follows: Gearing ratio = Total liabilities ÷ (Total assets – Total liabilities)
Gearing ratio can offer valuable insights into how much debt a company has taken on relative to its total assets, giving investors a clearer picture of the impact of financial leverage on the company’s profitability and risk profile. Additionally, it can help assess a company’s ability to meet its interest payments and service its debt obligations more effectively.
By understanding the significance of these modifications to the D/E ratio, investors can gain valuable insights into a company’s financial position and make informed investment decisions based on an accurate assessment of risk and return potential.
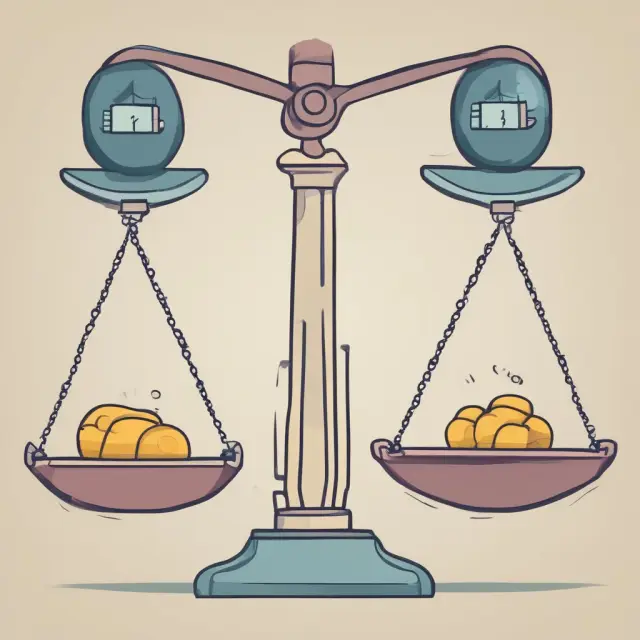
Personal Debt-to-Equity Ratios
A debt-to-equity (D/E) ratio not only plays a critical role in assessing a company’s financial health but also has applications for individuals seeking to understand their own financial position. In this section, we will discuss how the D/E concept can be applied to personal financial statements to evaluate individual ability to pay debts and secure loans.
The debt-to-equity ratio is calculated by dividing a company’s total liabilities by its shareholder equity or, for an individual, the difference between their total assets and aggregate debt or liabilities. The formula for calculating personal D/E ratios is:
Debt/Equity = Personal Assets – Liabilities Total Personal Liabilities
When individuals apply for loans, financial institutions often look at their personal debt-to-equity ratio to gauge their ability to meet debt obligations if they encounter a temporary loss of income. A more favorable personal D/E ratio can make an individual a more attractive borrower.
For example, consider someone with $500,000 in personal assets and $200,000 in total liabilities versus another person with the same personal assets but $300,000 in total liabilities. The first individual has a better D/E ratio of 1.4:1 (personal assets minus liabilities divided by total personal liabilities) than the second person, whose D/E ratio stands at 1.7:1. This indicates that the first individual may be more financially stable and capable of making loan payments in difficult economic conditions.
Comparing the personal debt-to-equity ratios to industry averages or benchmarks can provide further insight. For instance, a lower D/E ratio than the industry average suggests financial strength, while a higher one might indicate potential vulnerability.
In conclusion, understanding the concept of debt-to-equity ratio and its application to personal finances empowers individuals to make informed decisions regarding borrowing, saving, and managing their debts in a responsible manner.
It is essential to remember that D/E ratios are only one of many tools used by investors and lenders to assess financial health. Other factors like income statements, cash flow, creditworthiness, and economic conditions should also be considered when evaluating an individual’s or a company’s financial position.

Advantages and Limitations of D/E Ratio
Debt-to-equity (D/E) ratio is an essential financial metric for investors as it reveals a company’s reliance on debt financing versus equity. This ratio compares a firm’s total liabilities to its shareholder equity, shedding light on the extent of debt utilization in financing operations. In this section, we delve deeper into the advantages and limitations of using D/E ratio as an investment tool.
Advantages:
- Measures Financial Leverage: D/E ratio is a primary measure of financial leverage, indicating how much debt a company has taken on relative to its equity. By analyzing this metric, investors can assess the level of risk a company assumes when financing its growth through debt.
- Assessing Risk Profile: A high D/E ratio suggests increased financial risk as a company relies heavily on debt financing. Conversely, a low D/E ratio signifies a stronger balance sheet and less debt-driven growth.
- Comparison with Industry Peers: Evaluating the D/E ratios of industry competitors can provide valuable insights into a company’s competitive positioning and relative risk profile.
- Evaluation Over Time: By tracking changes in D/E ratio over time, investors can determine whether a firm is taking on more debt or reducing its reliance on debt financing.
- Monitoring Business Growth: A high D/E ratio may indicate that a company is aggressively pursuing growth through debt financing. It could also signal potential issues if the interest costs of debt service exceed the additional earnings generated from debt-financed investments.
- Insights for Institutional Investors: Debt-to-equity ratio is a crucial tool for institutional investors, enabling them to assess credit risk and identify potential investment opportunities in various sectors.
Limitations:
- Distorted by Accounting Practices: D/E ratio can be influenced by accounting practices like the treatment of intangible assets, pension plan adjustments, or stock-based compensation. Further research is often necessary to understand a company’s true debt and equity positions.
- Industry-Specific Limitations: Different industries have varying capital requirements and growth rates, making it essential to compare D/E ratios within the same sector for accurate analysis.
- Short-term vs Long-term Debt: Differences in short-term versus long-term debt can significantly impact the calculated D/E ratio. Understanding a company’s mix of short-term and long-term debt is essential to obtaining an accurate perspective on its financial situation.
- Modifications for Specific Analysis: Investors often modify the standard D/E ratio by focusing on long-term debt or adjusting for other factors, such as intangible assets, to better understand a company’s overall debt and equity position.
- Single Perspective of Financial Health: While D/E ratio offers valuable insights into a company’s financial leverage and risk profile, it does not provide a comprehensive understanding of a firm’s financial health or its ability to generate profitability. Additional ratios like current ratio, quick ratio, and return on equity can supplement this analysis.

Interpreting D/E Ratios for Institutional Investors
Debt-to-equity (D/E) ratios are crucial financial indicators for investors and creditors to assess a company’s financial leverage, risk profile, and potential impact on equity holders. Debt financing provides several advantages such as tax savings, increased earnings, and larger return on equity, but it also poses risks, including higher interest payments and potential insolvency if a company fails to meet its debt obligations. Institutional investors often examine D/E ratios to evaluate corporate debt levels, assess credit risk, and identify potential investment opportunities. In this section, we will delve deeper into how institutional investors interpret and make use of D/E ratios in their investment strategies.
High versus Low D/E Ratios
Investors often compare a company’s D/E ratio with that of its industry peers to assess the degree of risk and financial leverage. A higher D/E ratio signals greater reliance on debt financing, which can translate into increased financial risk for equity holders. Conversely, a lower D/E ratio suggests a more conservative balance sheet, potentially reducing risk for investors. It is important to note that industry averages differ significantly in terms of acceptable D/E ratios, and a high or low ratio may not necessarily be indicative of a good or bad investment opportunity.
Comparing D/E Ratios Over Time
Institutional investors also track changes in a company’s D/E ratio over time to assess the impact of management decisions on financial leverage. A steadily increasing D/E ratio could indicate deteriorating financial conditions, whereas a decreasing D/E ratio might suggest improved profitability and reduced reliance on debt financing.
Short-Term vs Long-Term Debt
Analysts differentiate between short-term and long-term debt when interpreting D/E ratios. Short-term debt is typically less risky as it matures within one year, whereas long-term debt carries greater financial risk due to its extended maturity. To adjust for this difference in risk levels, investors often calculate a company’s long-term D/E ratio by dividing long-term debt by equity instead of total liabilities.
Benchmarking D/E Ratios
Institutional investors utilize industry benchmarks to compare a company’s D/E ratio with its competitors to determine their relative risk and financial leverage positions in the market. A higher D/E ratio compared to peers may signal increased competition or industry-specific challenges that warrant further analysis. Conversely, a lower D/E ratio might suggest a competitive advantage or a more efficient use of capital.
Investment Implications
Institutional investors use D/E ratios in various ways to inform their investment decisions. For instance, they may screen for companies with favorable debt levels, identify potential merger and acquisition targets, evaluate the creditworthiness of fixed income securities, or adjust portfolio allocation based on changes in interest rates.
Limitations of D/E Ratios
Although a valuable tool, it is important to note that the D/E ratio has its limitations as an investment indicator. It does not consider factors such as cash flow, interest coverage ratios, and market conditions that can impact a company’s ability to meet its debt obligations. Additionally, D/E ratios may be distorted by accounting practices and one-time events, necessitating further research and analysis before reaching any investment conclusions.

FAQs on Debt-to-Equity Ratio
Debt-to-equity (D/E) ratio is a valuable financial metric used to assess a company’s financial leverage and debt level relative to its equity. This section will answer frequently asked questions about calculating, interpreting, and applying the D/E ratio.
What Does Debt-to-Equity Ratio Mean?
Debt-to-equity ratio is a financial measurement that compares a company’s total liabilities to its shareholder equity. It helps assess the extent of a company’s reliance on debt financing versus its own resources.
How Do You Calculate D/E Ratio?
To calculate D/E ratio, divide a company’s total liabilities by its total shareholders’ equity: Debt-to-equity = Total Shareholders’ Equity / Total Liabilities
What Information Is Needed to Calculate D/E Ratio?
The necessary data for calculating the D/E ratio can be found in a company’s balance sheet under liabilities and shareholder equity sections.
How Can You Interpret D/E Ratio?
A higher D/E ratio indicates that a company relies more on debt financing, which may increase investment risk. A lower ratio suggests less reliance on debt and potentially less risk.
Does D/E Ratio Vary by Industry?
Yes, industry averages for D/E ratios can serve as benchmarks when evaluating a specific company’s leverage position.
What Are Short-Term vs Long-Term Debt in the Context of D/E Ratio?
Short-term debt refers to obligations that must be repaid within one year, while long-term debt pertains to liabilities with maturities beyond one year. Analysts may modify the standard D/E ratio by focusing on long-term debt for a more accurate assessment of a company’s risk profile.
How Can Investors Use D/E Ratio for Evaluation?
Investors can use D/E ratio to assess credit risk, evaluate corporate debt levels, and identify potential investment opportunities in companies with favorable leverage positions compared to industry peers. Additionally, institutional investors may consider the ratio as part of a broader analysis, incorporating other financial indicators like profitability and growth expectations.
What Is a Good D/E Ratio?
A good or desirable debt-to-equity ratio depends on the specific industry and economic conditions. For instance, some industries may naturally have higher ratios due to their capital-intensive nature. A lower D/E ratio is generally preferred as it indicates less reliance on debt financing. However, it’s essential to consider a company’s industry context when evaluating its D/E ratio.
What Are the Advantages and Limitations of Using D/E Ratio?
The advantages of using the debt-to-equity ratio include assessing financial leverage, identifying potential risks, and facilitating comparisons between companies in the same industry. However, its limitations include the potential impact of accounting methods on reported debt and equity values, as well as differences in industry requirements and growth strategies.
 Next entry · No. 903Debt/Equity Swaps: Understanding This Unique Refinancing Strategy
See also
-
 No. 953
07 Jul 2024
20 min
Understanding Deleveraging: A Guide for Institutional Investors
Corporate Finance
No. 953
07 Jul 2024
20 min
Understanding Deleveraging: A Guide for Institutional Investors
Corporate Finance -
 No. 934
04 Jul 2024
18 min
Understanding the Defensive Interval Ratio (DIR): An Essential Liquidity Metric for Professional and Institutional Investors
Corporate Finance
No. 934
04 Jul 2024
18 min
Understanding the Defensive Interval Ratio (DIR): An Essential Liquidity Metric for Professional and Institutional Investors
Corporate Finance -
 No. 899
27 Jun 2024
17 min
Understanding the Debt-to-Capital Ratio: A Key Measurement for Investors
Corporate Finance
No. 899
27 Jun 2024
17 min
Understanding the Debt-to-Capital Ratio: A Key Measurement for Investors
Corporate Finance -
 No. 241
07 Apr 2024
19 min
Understanding the Importance of Asset Coverage Ratio in Finance: Measuring a Company’s Solvency
Corporate Finance
No. 241
07 Apr 2024
19 min
Understanding the Importance of Asset Coverage Ratio in Finance: Measuring a Company’s Solvency
Corporate Finance -
 No. 74
05 Apr 2024
17 min
Understanding the Accounting Equation: Assets, Liabilities, and Shareholders’ Equity
Corporate Finance
No. 74
05 Apr 2024
17 min
Understanding the Accounting Equation: Assets, Liabilities, and Shareholders’ Equity
Corporate Finance -
 No. 35
28 Mar 2024
19 min
Understanding Accounts Payable: An Essential Component of Business Finances
Corporate Finance
No. 35
28 Mar 2024
19 min
Understanding Accounts Payable: An Essential Component of Business Finances
Corporate Finance