Understanding Double Tops in Finance: A Bearish Technical Reversal Pattern

Learn the ins and outs of double tops, a bearish technical reversal pattern that can help investors identify potential price reversals in financial markets.
Introduction to Double Tops
A double top is an essential technical reversal pattern that provides insight into the potential trend change of a financial asset. This bearish pattern indicates that an asset has reached its peak twice at approximately the same price level, with a moderate decline between those peaks. To confirm this pattern, it is crucial to identify whether the price subsequently breaks below a significant support level – the low point between the two highs (Figure 1).
Double Tops Significance
A double top signals a potential reversal from an uptrend or a trend change in an asset class. For example, let us examine Amazon.com Inc. (AMZN) and Netflix Inc. (NFLX), both shown in Figure 2 and Figure 3 respectively, to better understand the significance of this pattern.
Amazon.com Double Top (Figure 1)
In the case of Amazon, the stock formed a double top between September and October 2018, around $2,050. The crucial support level in this instance was at approximately $1,880. Although the price dropped by nearly 8% from the October peak to the support level, it was not enough to confirm the double top. The confirmation came after the stock fell below $1,880, leading to a decline of almost 31% from the December low.
Netflix Double Top (Figure 2)
In contrast, Netflix did form two highs at approximately $405 in March and April 2018, but it failed to create a double top because support was never broken or even tested as the stock continued its upward trend.
However, later in the chart, Netflix formed another potential double top in June and July, this time with support being broken at $380, resulting in a sharp decline of 39% to $231 by December. An essential aspect of identifying a double top is recognizing that it can be challenging to differentiate between a true double top and a failed one (discussed further in the next section).
Stay tuned for the next sections, where we will explore the identification process of double tops, their significance as support levels, potential pitfalls when interpreting false double tops, real-world scenarios, limitations, and strategies to mitigate risks.

Identifying Double Tops
A double top is a powerful technical reversal pattern that appears deceptively simple – it requires just two consecutive highs followed by a moderate decline in price. However, correctly identifying a double top can be more challenging than it seems because of the critical confirmation step: waiting for the asset to break below support levels. The importance of this step cannot be overstated as only a confirmed double top, with a subsequent fall below the crucial support level, represents a genuine bearish signal.
Consider an example using Amazon.com Inc. (AMZN) from September and October 2018. In this scenario, we observe two highs around a price of $2,050. After the first peak, the stock price declines moderately before revisiting and falling just short of the prior high, forming a potential double top. Crucially, there is no confirmation as the support level, established at approximately $1,880, remains unbroken. The stock continues to trade within this range for some time until it eventually falls significantly below the support level in late 2018.
Now let us examine Netflix Inc. (NFLX) from March and April 2018, which initially appears to present a double top formation. However, upon closer inspection, we notice that despite a decline after the first peak, the stock never falls below the support level at around $380. Although the stock experiences a brief dip in price, it does not confirm the pattern and instead continues along an uptrend.
It is vital to exercise patience while identifying double tops and not jump to conclusions based on the mere appearance of two consecutive peaks. A false reading could lead to unnecessary selling or missed opportunities if the support level is not broken, as seen with Netflix.
In summary, the key to correctly interpreting a double top lies in the confirmation step: waiting for the asset’s price to fall below the critical support level before considering it as a genuine bearish signal.

The Difference Between a Double Top and a Failed Double Top
When analyzing financial charts for potential reversal patterns, investors often come across the term ‘double top.’ This technical pattern can serve as an essential indicator of a medium or long-term trend change in asset classes. However, it’s crucial to distinguish between a legitimate double top and a false one, as the consequences could vary significantly.
A double top is characterized by two consecutive peak formations with a moderate decline between them. The confirmation of this pattern occurs when the asset price falls below a key support level equal to the low between the two highs. This support level acts as a strong resistance level in the future, which may lead to a sharp sell-off in the stock or asset price.
For instance, let us consider Amazon.com Inc.’s (AMZN) chart from September and October 2018. During this period, the stock displayed a double top formation around $2,050. However, it wasn’t until the stock fell below the vital support level of approximately $1,880 that the double top was confirmed. Once confirmed, Amazon’s stock experienced a significant decline, plummeting almost 31% to a price of $1,400 by December 2018.
On the other hand, Netflix Inc.’s (NFLX) chart from March and April 2018 may appear to exhibit a double top pattern. However, in this case, there was no confirmation as the support level at $380 was never broken or even tested, and the stock continued along its uptrend.
In contrast, Netflix displayed another potential double top formation in June and July 2018, but this time it proved to be a reversal pattern. The stock price indeed fell below the support level at $380, resulting in a decline of nearly 39% to a price of $189 by December 2018. Furthermore, notice how the support level acted as resistance on two occasions in November while the stock was trending upwards.
The key distinction between a double top and a failed double top lies in the confirmation process. A failed double top can occur when investors misinterpret a mere price peak formation for a true reversal pattern or exit their positions too soon based solely on the double top indicator. This premature exit could lead to missing out on potential gains or even incurring additional losses in the future.
In conclusion, understanding the difference between a legitimate double top and a failed one is crucial for investors seeking to make informed decisions regarding their investment portfolios. Be sure to follow the confirmation process closely and wait patiently for support levels before jumping to conclusions.
Understanding Support Levels
Support levels play a significant role in the confirmation of a double top pattern. A support level is an essential price point at which a stock or other financial asset is expected to find buying interest, preventing further price declines. When two highs form near the same resistance level, it creates a potential double top pattern. However, without confirming the support level below the second peak, this pattern remains inconclusive.
To identify a double top formation, it is essential to be aware of both peaks’ significance and the support level in between them. For instance, when an asset forms two consecutive highs around the same resistance level but does not break below the support level in-between, it may not be considered a double top. Instead, it may simply be a failed attempt at reaching higher price levels.
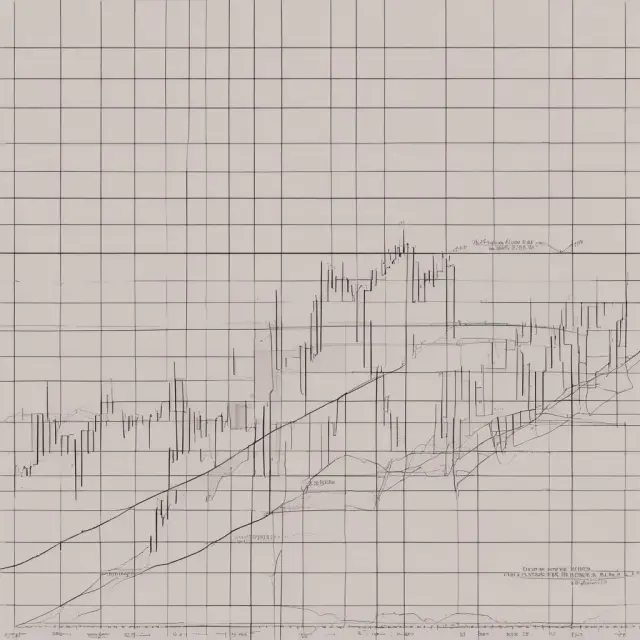
Let us look at a real example of Amazon.com Inc.’s (AMZN) stock to better understand this concept:
In the chart above, we can see the formation of what appears to be a double top pattern in AMZN stock between September and October 2018 around a price of $2,050. However, it wasn’t until the stock fell below the crucial support level at $1,880 that we could confirm the presence of a double top. The importance of identifying the confirmation of this support level cannot be overemphasized as it signaled the shift in the medium to long-term trend for Amazon shares.
Once the double top pattern is confirmed, investors may consider exiting their positions in the asset or shorting it if they anticipate a further decline. It’s crucial to remember that patience and careful analysis are essential when dealing with double top patterns, as false signals can occur if one jumps to conclusions based solely on two consecutive high peaks without considering the support levels.
However, it is important to note that while double tops provide valuable insight into potential price reversals, they should not be the sole basis for making investment decisions. It’s always a good practice to consider various indicators and market conditions before making any significant moves in your portfolio.

Interpreting False Double Tops
Identifying a double top pattern in financial charts might lead investors to anticipate a significant price decline. However, interpreting false double tops as real ones could lead to unnecessary losses. To avoid this pitfall, it is crucial to understand the key differences between a legitimate double top and a failed double top.
A genuine double top signals a medium or long-term trend change in an asset class when two consecutive peaks are reached with a moderate decline between them. Once the asset’s price falls below a support level equal to the low between the two high peaks, it confirms the pattern as bearish. For instance, let’s examine Amazon.com Inc.’s (AMZN) stock chart from September and October 2018, where we can see a double top pattern forming around the price of $2,050. The critical support level in this case was around $1,880, which held strong until the shares fell below it, eventually causing a decline of almost 31% to $1,644.
On the other hand, a failed double top occurs when an asset reaches two consecutive peaks but fails to break the critical support level and instead continues its uptrend. This scenario can be illustrated by Netflix Inc.’s (NFLX) stock chart from March and April 2018. Despite forming what appears to be a double top pattern around $390, the shares never fell below this level and continued their upward trend. However, it’s important to note that a few months later in the chart, Netflix formed another double top in June and July around $420. In contrast, this time, the support level at $420 was breached, leading to a decline of 39% down to $231 in December.
The distinction between these patterns is essential because interpreting false double tops as real ones could result in unnecessary losses for investors. A bearish signal based on two consecutive peaks alone might not be accurate enough to warrant selling or shorting an asset. Instead, patience and a thorough understanding of the support level are required before making investment decisions.
It is worth noting that double top formations can be challenging to identify correctly due to their inherent ambiguity. For example, the price might bounce back after touching the support level, only to fall again in the future. In such cases, investors should consider using other technical indicators or fundamental analysis to confirm their suspicions before making any decisions.
In summary, interpreting false double tops can lead to costly mistakes for investors, so it’s crucial to be aware of this risk and take a patient, informed approach when analyzing potential double top formations in financial charts.

Double Top Formations in Real-World Scenarios
A double top is an important technical reversal pattern that signals a potential change in the trend of an asset. This pattern becomes apparent when an asset reaches a high price two consecutive times with a moderate decline between them. However, it’s essential to note that a confirmed double top does not occur until the asset breaks below a significant support level – the low between the two prior highs. In this section, we will explore how this technical pattern manifests in real-world scenarios using Amazon.com Inc. (AMZN) and Netflix Inc. (NFLX) as examples.
First, let us examine Amazon’s price history around September and October 2018. During this timeframe, the stock formed what appeared to be a double top pattern, reaching a high of approximately $2,050 twice – in late August and early October. Between these two peaks, the stock experienced a decline of nearly 8%. The critical support level in this scenario was around $1,880. However, even though the stock fell below this level, it did not confirm the double top until the price eventually broke below $1,880 – a significant development that ultimately led to an almost 31% decline in price.
Another example can be seen in Netflix Inc.’s (NFLX) price chart during March and April 2018. During this period, it seemed as though Netflix had formed a double top at around $380; however, the support level was never tested or broken. Instead, the stock continued its uptrend. However, in late June and July of that same year, Netflix did form a legitimate double top with a subsequent breakdown below the support level of $380. This reversal pattern ultimately resulted in a 39% decline to $231 by December.
Furthermore, it’s worth noting that in Netflix’s price history during November, support at $380 also acted as resistance on two occasions when the stock was attempting to rise. This is an important detail that underscores the significance of understanding double tops and their potential implications.
It’s important to remember that while double tops can be highly effective in signaling potential trend changes, they must be identified correctly to avoid premature decisions that could negatively impact your investment portfolio.

Limitations of Double Tops
While the double top pattern is a potent technical reversal signal, it’s important to understand that relying on this indicator alone can have limitations. A few potential challenges are outlined below.
1. False Signals: The double top pattern might not always be accurate due to its reliance on specific price levels and trends. In some cases, a stock may appear to form a double top only to reverse course and continue rising. This is known as a “false double top” or a “double top failure.” These situations can cause significant losses for investors who prematurely sell their positions based on the false signal.
2. Short-term vs. Long-term Perspective: Double tops are primarily focused on identifying medium to long-term trend reversals, and a false double top may only represent a short-term correction within an uptrend. In such instances, it’s essential for investors to consider the broader market conditions and other technical indicators before acting on a potential double top signal.
3. Volatility: Double tops can be challenging to identify in highly volatile stocks due to their tendency to produce false signals or whipsaws. It’s crucial to exercise patience and wait for a clear confirmation of a double top pattern by the price breaking below the key support level before making any investment decisions.
4. Contextual Analysis: Double tops should not be considered in isolation but instead as part of an overall analysis that includes other technical indicators, fundamental factors, and market conditions. Investors should consider using other tools such as moving averages, momentum indicators, or trend lines to validate a potential double top signal and minimize the chances of being misled by false signals.
5. Human Error: Double tops may be challenging for even experienced traders to spot, making it essential to double-check chart patterns and ensure proper identification before acting on a potential double top signal. Human error in interpreting price charts or misplacing support levels can result in missed opportunities or incorrect investment decisions.
In conclusion, while the double top pattern is a powerful technical reversal indicator, its limitations must be acknowledged and accounted for when considering it as part of an overall investment strategy. By understanding these potential challenges and exercising patience, investors can increase their chances of successfully identifying genuine double tops and taking advantage of bearish price movements.

Mitigating Risks with Double Tops
Double tops can be a powerful tool for investors when used wisely. However, interpreting these formations correctly is crucial for risk management. Incorrectly identifying a double top could lead to premature selling or unnecessary losses. Here are some strategies to help mitigate the risks associated with double tops:
1. Confirmation of Support Levels
Confirming a double top involves the price dropping below the support level that lies between the two highs. This level is vital in confirming the reversal pattern. Patience is key here as it can be tempting to assume a double top based on the formation of two consecutive highs alone. However, waiting for the confirmation of the support level being breached ensures a more robust understanding of the price action.
2. Factor in Market Volatility and Trend Direction
Double tops are typically considered bearish signals. However, it is essential to understand the broader market context before making decisions based on them. For instance, a double top can occur in an uptrending market, which may not necessarily signal a long-term reversal but rather a correction within the trend. Additionally, heightened volatility in the market could cause momentary dips below the support level, which might result in false signals.
3. Monitor Multiple Timeframes
Double tops can manifest themselves across various time frames. Therefore, it’s crucial to monitor multiple timeframes to understand the significance of a potential double top within different contexts. For example, a double top that appears on a daily chart may not necessarily be relevant for those trading intraday or hourly charts.
4. Use Stop Losses and Position Sizing
Implementing effective risk management practices is crucial when dealing with double tops. Proper position sizing and stop losses can help limit potential losses while allowing for the opportunity to capitalize on a confirmed reversal. This approach ensures that an investor’s portfolio remains protected while taking advantage of bearish price movements.
In conclusion, double tops can be an effective technical analysis tool when used correctly. However, they also carry inherent risks due to their potential for false signals. Employing the strategies mentioned above helps mitigate these risks and provides a more informed approach when considering market entry or exit points based on double top formations.
Utilizing Double Tops in Portfolio Management
Double tops can serve as valuable tools for investors in managing their portfolios by providing crucial insights into potential trend reversals. Identifying a double top formation in an asset can help investors make informed decisions and mitigate risks. However, it is essential to approach these patterns with caution, understanding their limitations and potential pitfalls.
First and foremost, investors must be patient when dealing with double tops. The confirmation of this pattern comes only after the asset’s price falls below a support level that coincides with the low between the two prior highs. This process may take time, making it essential to remain disciplined and not jump into action prematurely.
One strategy investors can employ when dealing with double tops is setting stop-loss orders just above the resistance level where the double top peaks form. This approach allows for risk management while waiting for confirmation of a bearish reversal. Upon confirmation, investors may then consider selling their positions or even shorting the stock to profit from the anticipated downward trend.
However, it’s important to remember that not all double tops are legitimate. False double tops can occur, leading to potential losses if one acts on an incorrect assumption. Proper analysis and confirmation of a bearish reversal pattern using support levels is crucial before making any investment decisions based on double tops.
It’s also worth noting that double tops are just one tool in the vast arsenal of technical analysis. They should not be considered as standalone indicators but rather be used in conjunction with other fundamental and technical data to form a comprehensive investment strategy.
Lastly, investors should be aware of the limitations of using double tops alone for their portfolio management decisions. Other factors such as market trends, company financials, and news events can significantly impact an asset’s price action. A well-diversified portfolio consisting of various assets classes, stocks, bonds, and other investment vehicles is always recommended to minimize risk and maximize potential returns.

FAQs on Double Tops
What exactly is a double top in finance?
A double top is a bearish technical reversal pattern that forms when an asset reaches a high price two consecutive times with a moderate decline between them. It is considered valid once the asset’s price falls below a support level equal to the low between those two highs.
What can a double top indicate for investors?
A double top signals a potential medium or long-term trend change for an asset class. It represents an opportunity for investors to sell their positions and secure profits or short the stock, assuming they believe that the price will continue its downward movement.
What distinguishes a double top from a failed one?
The difference lies in confirmation. A true double top is confirmed when the asset’s price falls below the critical support level established between the two highs. Conversely, if the asset fails to break this support level, it might merely indicate a temporary reversal or correction within an uptrend.
How difficult is it to identify a double top?
Despite its significance as a bearish indicator, spotting a double top can be tricky because investors need to wait for confirmation with a breakdown of the crucial support level. Be sure to be patient and attentive when monitoring potential double top formations.
What are some examples of double tops in real-world scenarios?
Amazon.com Inc. (AMZN) formed a double top between September and October 2018, with a key support level around $1,880. The stock fell nearly 8% from its October peak before confirming the pattern by dropping below this support level. The subsequent decline amounted to almost 31%. Similarly, Netflix Inc. (NFLX) experienced two possible double top formations in March and April 2018 and later in June and July. However, only the second instance proved valid as a reversal pattern because it involved a clear break below support at $380, causing a decline of 39% to $231.
What should you avoid when interpreting double tops?
Avoid making hasty conclusions based solely on two consecutive highs without proper confirmation via a support level breakdown. The failure to differentiate between real and failed double tops can lead to premature exits from positions or missed opportunities.
Can double tops be combined with other indicators for added insight?
Absolutely! Double tops are just one component of technical analysis, and integrating them with other indicators (e.g., moving averages, RSI) can enhance the overall accuracy and reliability of your investment decisions.
In conclusion, double top formations serve as a valuable tool for investors seeking to capitalize on potential medium or long-term trends in asset classes. However, it’s crucial to be patient, attentive, and well-informed when dealing with this technical reversal pattern. By understanding the key elements of double tops, their differences from failed double tops, and their limitations, you can make more informed investment decisions that ultimately contribute to a successful portfolio strategy.
 Next entry · No. 1,121Understanding Double Taxation: The Contentious Issue of Taxing Income Twice
See also
-
 No. 5,331
30 Aug 2025
18 min
Understanding Upgrades: What They Mean, How They Impact Investments, and Their Importance in Finance
Business Finance
No. 5,331
30 Aug 2025
18 min
Understanding Upgrades: What They Mean, How They Impact Investments, and Their Importance in Finance
Business Finance -
 No. 3,198
09 Mar 2025
17 min
Understanding Midcap Funds: Balancing Growth and Stability
Business Finance
No. 3,198
09 Mar 2025
17 min
Understanding Midcap Funds: Balancing Growth and Stability
Business Finance -
 No. 5,703
30 Sep 2025
20 min
Understanding White Candlesticks in Finance: Meaning, Interpretation, and Significance for Institutional Investors
Financial Data Analysis
No. 5,703
30 Sep 2025
20 min
Understanding White Candlesticks in Finance: Meaning, Interpretation, and Significance for Institutional Investors
Financial Data Analysis -
 No. 2,750
01 Feb 2025
24 min
Understanding Laddering: A Strategic Investment Approach for Fixed Income
Business Finance
No. 2,750
01 Feb 2025
24 min
Understanding Laddering: A Strategic Investment Approach for Fixed Income
Business Finance -
 No. 1,738
30 Oct 2024
22 min
Understanding Gaps in Finance: Types, Significance, and Strategies
Business Finance
No. 1,738
30 Oct 2024
22 min
Understanding Gaps in Finance: Types, Significance, and Strategies
Business Finance -
 No. 1,705
25 Oct 2024
20 min
Understanding Fund Flow: A Key Indicator for Institutional Investors
Business Finance
No. 1,705
25 Oct 2024
20 min
Understanding Fund Flow: A Key Indicator for Institutional Investors
Business Finance