Understanding Net Volume: A Technical Indicator for Professional and Institutional Investors

Learn the importance of Net Volume in technical analysis for professional & institutional investors, including how it's calculated, interpreted, and used in…
Introduction to Net Volume
Net Volume: A Powerful Technical Indicator for Professional and Institutional Investors
Net volume is an essential technical indicator for professional and institutional investors, offering unique insights into market sentiment that cannot be found in standard volume metrics. This valuable indicator is calculated by subtracting a security’s uptick volume from its downtick volume within a particular timeframe, providing a clear representation of the net buying or selling pressure during that period.
Net volume, unlike traditional volume, offers investors a more nuanced understanding of market dynamics as it differentiates between bullish and bearish shifts in trading sentiment. Positive net volume signifies a bullish trend, while negative net volume indicates a bearish one. By analyzing net volume alongside popular technical analysis tools like chart patterns, indicators, and buy/sell signals, investors can make more informed decisions on potential trades.
To illustrate the importance of net volume, let us consider an example of thinly traded stock undergoing significant price fluctuations. In this scenario, a security might experience five downward trades at 200 shares each, resulting in a total decline of five percent. Conversely, it may only have one upward trade at 10,000 shares, causing the stock to rise by three percent. Despite closing two percent lower, this net volume would be a positive 9,000—a significant indicator of underlying bullish momentum that might otherwise go unnoticed using traditional volume measurements alone.
Net Volume vs. Standard Volume: Key Differences and Implications
Net volume is an essential addition to any technical analysis toolkit, particularly for professional and institutional investors who seek a more nuanced understanding of market dynamics. Net volume differs from standard volume in several ways, offering valuable insights into the depth and directionality of trading activity within specific timeframes:
- Market Sentiment: Net volume provides an accurate representation of the overall sentiment in the market by differentiating between bullish (uptick) and bearish (downtick) periods. This information can help investors to identify emerging trends, assess potential entry and exit points, and gauge investor confidence levels.
- Hidden Momentum: Net volume reveals the underlying momentum that may be hidden beneath the surface, particularly in thinly traded securities or during periods of high volatility. By examining net volume alongside other indicators like chart patterns and RSI, investors can gain a more comprehensive understanding of market dynamics and anticipate potential price movements.
- Divergence: Net volume can help to identify divergence between price and volume trends, providing early warning signals for potential shifts in market sentiment. For example, if the stock price is making new highs but net volume is declining, it might indicate a lack of underlying support or a potential reversal in trend.
- Enhanced Trading Signals: Net volume can be used to enhance trading signals derived from other indicators and chart patterns by providing additional context on the strength and directionality of buying and selling pressure. For instance, if a stock breaks out from a key resistance level but net volume remains negative, it may suggest that the breakout is not sustainable or that there are underlying bearish forces at play that could lead to profit-taking or a potential reversal in trend.
In conclusion, understanding net volume and its implications for market sentiment analysis is crucial for professional and institutional investors seeking to make informed investment decisions. By using this powerful technical indicator alongside other popular tools like chart patterns and indicators, investors can gain a more comprehensive understanding of market dynamics and anticipate potential trends, ultimately leading to better-informed trades and improved portfolio performance. In the next section, we will discuss how net volume is calculated and explore some practical examples to help illustrate its usage.

Calculating Net Volume
Net volume is an intriguing technical indicator used by professional and institutional investors to better understand market sentiment and identify potential trading opportunities. By calculating net volume, traders can distinguish bullish and bearish shifts in the market, uncovering trends that may not be immediately apparent through standard volume analysis. In essence, net volume signifies the difference between uptick volume and downtick volume over a specified period.
First, let’s define uptick and downtick volumes:
- Uptick volume refers to the number of shares traded during an uptrend, or a series of rising prices. An uptick represents a trade where the price of the security rises from one price level to another.
- Downtick volume, on the other hand, encompasses the number of shares transacted throughout a downtrend, or a sequence of falling prices. A downtick signifies a trade in which the security’s price declines from one level to another.
To calculate net volume, traders subtract the downtick volume by the uptick volume over the desired time frame. The result is then displayed as net volume bars below the price chart. These bars indicate whether the net volume reading for a given period was positive or negative.
A positive net volume signifies that during the specified period there were more trades where prices moved up than down, which implies bullish sentiment. Conversely, a negative net volume indicates that more trades experienced price declines during the same time frame, suggesting bearish sentiment.
By analyzing net volume along with traditional technical analysis tools like chart patterns and indicators, investors can gain a comprehensive understanding of market movements, providing valuable insights into potential opportunities for profit-taking or risk management. For instance, if a stock breaks out from a key resistance level, traders may use net volume to assess the strength of the underlying momentum and evaluate whether it’s worth pursuing further based on the bullish or bearish sentiment indicated by the indicator.
Net volume is particularly useful for institutional investors as it offers insights into market trends that might otherwise be overlooked through standard volume analysis alone. It’s essential to note, however, that net volume isn’t a perfect tool and must be used in conjunction with other forms of technical analysis to generate accurate readings. Additionally, there are some limitations associated with net volume analysis for thinly traded securities due to potential liquidity concerns. Nonetheless, net volume can be an essential addition to any institutional investor’s arsenal when searching for reliable indicators of market sentiment and trends.
In the next section, we’ll explore how net volume interacts with other popular momentum indicators such as the money flow index (MFI), on-balance volume (OBV), and the relative strength index (RSI).

Interpreting Net Volume
Net volume is a technical indicator that represents the difference between uptick volume and downtick volume for a given security over a specified time period. It provides insight into the underlying market sentiment beyond standard volume measurements. By examining net volume, investors can understand whether bullish or bearish momentum is driving trading activity within a particular stock.
Positive Net Volume (Bullish Indication): When the upticks in a security outnumber downticks during a given period, resulting in positive net volume, it suggests that bullish sentiment dominates the market. This bullish indication may be particularly valuable for traders when combined with other technical analysis tools, such as chart patterns and indicators, to identify potential buying opportunities.
Negative Net Volume (Bearish Indication): Conversely, a negative net volume indicates that downticks have outnumbered upticks in the specified timeframe. This bearish indication may help traders assess if there is enough selling pressure to warrant short positions or defensive strategies when used in conjunction with other technical indicators and chart patterns.
Bullish Chart Patterns and Net Volume: For instance, a breakout from a key resistance level can be followed by analyzing net volume to determine the strength of buying momentum behind the move. If bullish momentum is strong, investors may expect the stock price to continue rising if the net volume remains positive. Conversely, if the net volume is negative during a bullish chart pattern, it could indicate a false breakout or a weakened trend.
Comparing Net Volume and Other Momentum Indicators: Net volume shares similarities with other momentum indicators such as the money flow index (MFI), on-balance volume (OBV), and the relative strength index (RSI). While these indicators all provide valuable insights into market sentiment, net volume’s unique feature is its focus solely on volume during a single period. Understanding net volume can provide traders with an additional perspective when evaluating trends, chart patterns, or potential opportunities using various momentum indicators.

Net Volume vs. Other Momentum Indicators
Net volume is an intriguing technical indicator that differs from traditional volume measures by revealing bullish or bearish sentiment based on the relationship between uptick and downtick volumes over a specific timeframe. In essence, it provides traders with a deeper understanding of underlying market dynamics, complementing other momentum indicators like money flow index (MFI), on-balance volume (OBV), and the relative strength index (RSI).
The Money Flow Index (MFI) and Net Volume
Both net volume and MFI aim to provide insights into the buying and selling pressure in a market. However, while MFI incorporates price data along with volume to assess momentum shifts, net volume focuses solely on volume differences between upticks and downticks within a timeframe. The primary advantage of net volume is its simplicity and ease of interpretation when compared to the more complex calculations involved in determining MFI values.
The On-Balance Volume (OBV) and Net Volume
Net volume and OBV share a common goal in their approach to analyzing volume data. However, while OBV computes cumulative volume changes based on positive and negative price shifts, net volume examines the immediate relationship between uptick and downtick volumes for each period. Net volume can be considered as a snapshot of volume data in real-time, making it an attractive option for traders who want to make quick decisions without having to wait for long-term trends to develop.
Net Volume vs. The Relative Strength Index (RSI)
Though RSI and net volume share similarities in their focus on momentum shifts, the two indicators have distinct differences. While net volume is concerned with understanding bullish or bearish volume shifts within a specific timeframe, RSI measures the magnitude of gains and losses to derive an overbought/oversold reading for a security. Net volume can serve as an excellent complement to the RSI when seeking a more in-depth view of a market’s momentum trends.
In summary, net volume stands out among various momentum indicators because it offers traders a succinct and straightforward perspective on underlying bullish or bearish sentiment within a particular timeframe. While other indicators like MFI, OBV, and RSI have their unique strengths and applications, net volume plays a vital role in offering a clear snapshot of the market dynamics for quick analysis and decision-making.
Using Net Volume in Trading Strategies
Net volume plays an essential role in understanding the underlying market sentiment and dynamics of a security, which can be particularly valuable when used alongside other popular technical analysis tools such as chart patterns, indicators, and buy/sell signals. By combining net volume with these techniques, traders can gain a more comprehensive perspective on potential opportunities.
One common application for net volume is in the context of identifying potential breakouts from key resistance or support levels. For instance, if a stock appears to be breaking out from an established resistance level, examining its net volume trend may help determine whether there’s sufficient buying pressure behind the move and assess the likelihood of continuation.
The interpretation of net volume also varies depending on the overall market context and trends. In a bullish market environment, positive net volume suggests that a security is experiencing a strong bullish upswing. Conversely, in a bearish market context, negative net volume may indicate that selling pressure is mounting, even if the price action appears to be somewhat neutral or sideways.
Comparatively, other momentum indicators like moving averages and the relative strength index (RSI) focus on different aspects of price movement and trends. While net volume measures the net change in volume over a specific time frame, indicators such as moving averages offer insights into historical price trends and momentum. The RSI, for its part, assesses the magnitude of recent price gains or losses to provide an overall sense of market strength or weakness.
For example, consider a trader who is considering entering a long position in a stock that has recently experienced a significant price decline but now appears to be forming a potential double bottom pattern on the chart. In this situation, examining net volume may help confirm the presence of strong buying pressure beneath the stock, which could indicate an imminent reversal and potentially profitable entry point.
In summary, incorporating net volume into your technical analysis toolkit can provide valuable insights that complement traditional techniques like chart patterns, indicators, and buy/sell signals. By examining net volume trends alongside these other tools, traders may be able to make more informed decisions regarding potential entries or exits based on a more nuanced understanding of market sentiment.

Benefits of Using Net Volume for Institutional Investors
Net volume plays an essential role in providing valuable insights to institutional investors who use technical analysis in their investment strategies. By examining net volume, these professionals can gain a deeper understanding of market sentiment and identify potential opportunities that may not be immediately apparent from standard volume data or other traditional indicators. Here are some advantages of using net volume for institutional investors:
1. Accurately Measuring Market Sentiment: Net volume is particularly useful when assessing the underlying trend in a security’s trading activity. It allows investors to see if there is more buying pressure than selling pressure or vice versa, enabling them to make informed decisions based on this information. For instance, if a company experiences significant net positive volume despite a declining price trend, it might indicate that large institutional buyers are accumulating shares in anticipation of a future price rebound.
2. Enhancing Trading Decisions: Net volume can serve as a confirmation tool when used alongside traditional chart patterns and technical indicators. For example, if an investor spots an bullish reversal pattern like the “hammer” or “inverted hammer,” they might use net volume to confirm that the buying pressure behind the reversal is substantial enough for a long position entry.
3. Identifying Potential Buying and Selling Opportunities: Net volume can help institutional investors identify potential buying or selling opportunities by providing clues about the strength of certain price movements. For instance, if a stock experiences large positive net volume during an uptrend, it might suggest that there is strong underlying demand for the security, making it a good candidate for accumulation.
4. Monitoring Market Trends and Sentiment: Net volume can help institutional investors keep track of broader market trends and sentiment by providing insights into how various securities are moving relative to one another. For example, if net volume is consistently positive in a particular sector while other sectors have negative net volume, it could indicate that the former is experiencing strong buying pressure and may be worth further investigation.
In conclusion, net volume is an essential technical indicator for institutional investors seeking to gain a deeper understanding of market sentiment and identify potential trading opportunities. Its unique ability to highlight buying and selling pressures over a single period makes it an invaluable tool when used alongside other forms of technical analysis and indicators. By using net volume as part of their investment strategies, institutional investors can make informed decisions based on real-time market data and stay ahead of the curve.

Case Study: Understanding Net Volume with an Example
Net volume is a powerful technical indicator that can help traders assess market sentiment by subtracting uptick volume from downtick volume over a specific time frame. In this section, we will delve into the importance of net volume through an illustrative example, showcasing how it provides valuable insights beyond standard volume analysis.
Imagine a trader observes a stock undergoing a 5% downward price movement due to five separate trades with 200 shares each. Conversely, there is one trade that represents a bullish upward swing, comprising a massive 10,000 share transaction moving the stock up by 3%. The stock eventually closes 2% lower overall; however, net volume reveals the underlying momentum of this security.
Calculating Net Volume
To calculate net volume for this example, we’ll first determine the uptick and downtick volumes:
– Uptick Volume: 10,000 shares
– Downtick Volume: 2,500 * 5 = 12,500 shares
Now, we’ll find the net volume by subtracting the downtick volume from the uptick volume: Net Volume = Uptick Volume – Downtick Volume = 10,000 – 12,500 = -2,500.
Despite a negative closing price movement and overall bearish sentiment, our net volume calculation reveals a bullish underlying trend with a significant buying pressure. The trader can then use this information to reassess the stock’s potential opportunities or risks based on the market sentiment unveiled by the indicator.
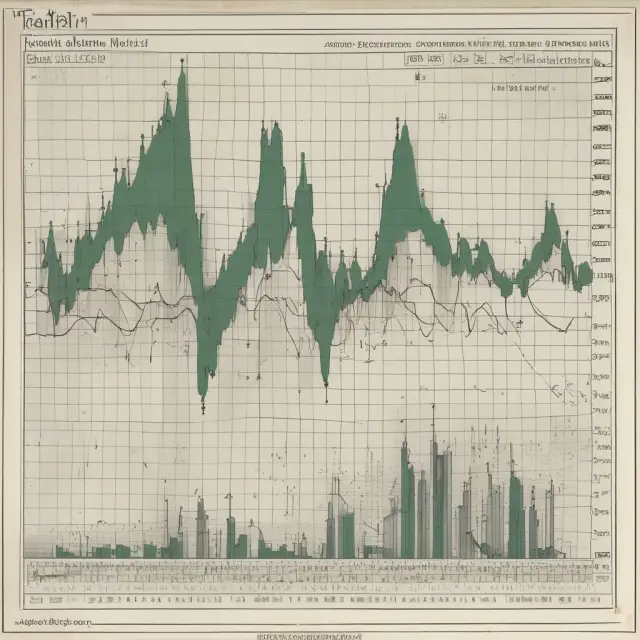
A closer look at the net volume chart reveals that the net volume bars sit below the price chart, indicating the bullish nature of the momentum shown in the example. Traders can utilize this information to identify significant buying and selling pressure shifts and adjust their investment strategies accordingly. By observing a positive net volume, they may consider entering long positions or increasing their existing holdings as a bullish trend is likely underway. Conversely, negative net volumes suggest bearish sentiment and a potential opportunity for short-selling or reducing exposure to the asset.
Comparing Net Volume to Other Momentum Indicators
Net volume is similar in some respects to other popular momentum indicators such as Money Flow Index (MFI) and On Balance Volume (OBV). These indicators provide insights into market interest, but they differ in their approach to measuring buying and selling pressure. Net volume looks exclusively at the volume over a single time frame, whereas MFI combines both price and volume for analysis. In contrast, OBV adds up volume on up days and down days over an extended period.
In some cases, traders may prefer using more intricate momentum indicators instead of net volume when examining potential investment opportunities. However, understanding net volume can be advantageous as it offers a straightforward method to assess the underlying momentum in a single timeframe, providing essential insights for informed decision making.

Limitations and Liquidity Concerns
While net volume offers valuable insights for institutional investors, it comes with its limitations. One of the primary concerns lies within thinly traded securities and liquidity issues that may arise when using this technical indicator.
Net Volume and Thinly Traded Securities
Thinly traded securities refer to stocks or assets with low trading volumes due to their small market capitalization, illiquid nature, or infrequent transactions. In such cases, net volume calculations can become unreliable as the number of upticks and downticks might not accurately represent true market sentiment since these securities may be subject to manipulation. Thus, it is essential for institutional investors to exercise caution when using net volume in analyzing thinly traded securities.
Liquidity Concerns
Another limitation concerns liquidity issues that can arise when calculating net volume. In highly volatile markets or during times of extreme market conditions like high volatility, the net volume indicator can be misleading due to the rapid increase in upticks and downticks occurring within a short period. As a result, institutional investors may want to consider alternative tools for assessing liquidity and market sentiment during such periods.
Best Practices
Institutional investors should employ best practices when using net volume to overcome these limitations. These include combining net volume with other technical indicators and fundamental analysis tools, as well as considering the overall market conditions before making investment decisions based on this indicator. Furthermore, it is crucial for traders to thoroughly research the security they’re analyzing to ensure that it meets the minimum criteria for reliable net volume calculations (e.g., sufficient trading volume).
In conclusion, while net volume provides valuable insights into underlying market sentiment, institutional investors must be aware of its limitations and exercise caution when working with thinly traded securities or during periods of high volatility. By following best practices and combining this indicator with other tools, they can effectively leverage the power of net volume for informed decision-making.

Best Practices for Using Net Volume Effectively
Net volume is a powerful technical indicator that can offer valuable insights into market sentiment and momentum. However, like all indicators, it’s essential to use net volume effectively to obtain accurate analysis. In this section, we discuss best practices for using net volume in your trading strategies and ensuring accurate analysis.
1. Combine Net Volume with Other Technical Indicators: While net volume can be a standalone indicator, it often provides more insight when used alongside other technical indicators. Consider plotting net volume below the price chart and comparing it to popular indicators like moving averages or the relative strength index (RSI). By doing so, you can assess the market sentiment and momentum from various perspectives.
2. Understand the Influence of Market Sentiment: Net volume is an excellent tool for gauging market sentiment. Positive net volume suggests a bullish trend, while negative net volume indicates a bearish one. However, it’s essential to understand that market sentiment can change rapidly. Be cautious when making trades based on a single indicator and consider using other factors such as news events and macroeconomic indicators before making decisions.
3. Consider the Stock’s Liquidity: Net volume is calculated by subtracting uptick volume from downtick volume, which might not be available for all securities, particularly thinly traded ones. In such cases, it can lead to inaccurate or unreliable net volume readings. Stick to more liquid stocks when using net volume and ensure that sufficient data is available before making investment decisions.
4. Use Net Volume in Chart Patterns: Net volume can provide valuable insights into chart patterns, especially when combined with other technical indicators. For instance, a bullish flag or pennant pattern might be confirmed by positive net volume during the consolidation phase, suggesting that there’s strong underlying buying pressure.
5. Utilize Multiple Timeframes: Analyzing net volume across multiple timeframes can offer a more comprehensive understanding of market sentiment and momentum. For example, compare the net volume reading on a daily chart to that of an hourly or minute-level chart to assess short-term and long-term trends.
6. Consider Net Volume in Relation to Price: A stock’s price trend and net volume trend should ideally move together. If there’s a significant divergence between the two, it may suggest that the current trend is weakening or even reversing. Keep an eye on these divergences to adjust your trading strategy accordingly.
By following these best practices, you can effectively use net volume in your investment analysis and potentially uncover hidden market trends that can help inform your investment decisions. Remember always to consider other factors like news events and macroeconomic indicators when making trades.

Frequently Asked Questions (FAQ)
What is Net Volume?
Net volume is a technical indicator that measures the difference between the number of upticks and downticks in a security’s price movements over a specific timeframe. By examining this net volume, traders can assess market sentiment and identify potential opportunities. In contrast to standard volume, which simply measures the quantity of trades conducted during a particular period, net volume offers valuable insights into bullish or bearish trends that may not be readily apparent from traditional volume analysis.
How is Net Volume calculated?
Calculating net volume involves subtracting a security’s downtick volume by its uptick volume within the chosen timeframe. Upticks represent price increases, while downticks denote price decreases. For instance, if 500 shares were bought when the stock price increased by $0.10 (an uptick), and 200 shares were sold as the stock declined by $0.08 (a downtick), the net volume would be calculated as follows: Net Volume = Uptick volume – Downtick volume = 500 – 200 = 300
What’s the difference between Net Volume and standard Volume?
While both indicators evaluate market interest in a security, net volume offers unique insights into bullish or bearish sentiment that may not be evident through traditional volume analysis alone. Standard volume measures the number of trades executed during a specified time period, whereas net volume identifies the directional bias by calculating the difference between uptick and downtick volumes within the chosen window.
What does positive Net Volume indicate?
A positive net volume indicates that there is more buying pressure than selling pressure, suggesting that the market sentiment is bullish for a particular security. When a stock experiences a positive net volume, it could be an indicator of a potential breakout or trend reversal, which may attract additional buyers and further fuel the upward momentum.
What does negative Net Volume indicate?
Negative net volume indicates that there’s more selling pressure than buying pressure, suggesting bearish market sentiment for a security. This can serve as a warning sign for traders when analyzing a stock or asset class, potentially indicating a downtrend or continuation of a bearish price trend.
How does Net Volume compare to other momentum indicators?
Net volume is similar to various momentum indicators in that it offers insights into market interest and potential trends within a security. However, it differs from other momentum indicators as net volume focuses solely on volume changes during a single time period. Some other popular momentum indicators, like the Money Flow Index (MFI) or On Balance Volume (OBV), provide additional context through their longer-term analysis or more complex calculations.
Can Net Volume help institutional investors?
Yes, net volume can be an invaluable tool for institutional investors, offering insights into market sentiment and potential opportunities that may not be visible through other means of analysis. Institutional traders often need to analyze large datasets to make informed decisions about portfolio allocations and risk management, making the ability to quickly assess bullish or bearish trends crucial. Net volume can be integrated with other tools like chart patterns and technical indicators to further refine their investment strategies.
 Next entry · No. 3,447The Power and Impact of the Network Effect in Finance and Investment
See also
-
 No. 4,915
27 Jul 2025
20 min
Technical Analysis 101: A Comprehensive Guide for Institutional Investors
Financial Education
No. 4,915
27 Jul 2025
20 min
Technical Analysis 101: A Comprehensive Guide for Institutional Investors
Financial Education -
 No. 4,911
27 Jul 2025
20 min
A Comprehensive Guide to Technical Analysis: Understanding Chart Patterns, Indicators, and Strategies
Finance Policy
No. 4,911
27 Jul 2025
20 min
A Comprehensive Guide to Technical Analysis: Understanding Chart Patterns, Indicators, and Strategies
Finance Policy -
 No. 4,565
29 Jun 2025
21 min
Scalping: A High-Risk Trading Strategy for Profiting from Minor Price Changes
Finance Policy
No. 4,565
29 Jun 2025
21 min
Scalping: A High-Risk Trading Strategy for Profiting from Minor Price Changes
Finance Policy -
 No. 4,065
19 May 2025
20 min
Price Rate of Change (ROC) Indicator: Understanding Momentum in Finance
Financial Education
No. 4,065
19 May 2025
20 min
Price Rate of Change (ROC) Indicator: Understanding Momentum in Finance
Financial Education -
 No. 3,941
09 May 2025
17 min
Understanding Pennants: A Technical Analysis Continuation Pattern
Financial Education
No. 3,941
09 May 2025
17 min
Understanding Pennants: A Technical Analysis Continuation Pattern
Financial Education -
 No. 3,779
26 Apr 2025
24 min
Understanding Orders in Finance: Market Order vs Limit Order vs Stop Order
Business Finance
No. 3,779
26 Apr 2025
24 min
Understanding Orders in Finance: Market Order vs Limit Order vs Stop Order
Business Finance