Understanding the Yearly Probability of Dying: An Essential Statistic for Institutional Investors
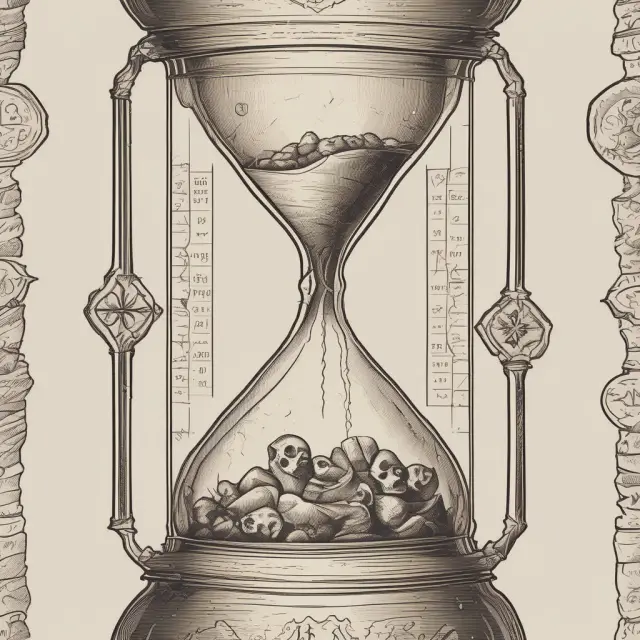
Understand yearly probability of dying in the context of institutional investing. Learn its calculation, factors, uses, and applications.
What is Yearly Probability of Dying?
The term “Yearly Probability of Dying” refers to an essential statistic that estimates the likelihood of a person passing away within a year, depending on their age and sex. This statistical figure plays a crucial role in various sectors, such as healthcare research, government planning, and the insurance industry. In this section, we will discuss the significance of yearly probability of dying, its calculation using mortality tables, and how it is used to determine life expectancy and insurance premiums.
Understanding Mortality Tables
Mortality tables, also known as actuarial or life tables, are statistical tools utilized to determine age-specific death rates. They calculate the number of deaths that occur during a particular time frame based on an initial population. These tables provide valuable insights into human mortality and have been instrumental in various fields for decades.
The origin of mortality tables can be traced back to the late 17th century when Edmond Halley, an English astronomer, compiled life tables for the Church of England clergy. Since then, mortality tables have become a cornerstone of actuarial science and insurance mathematics.
Mortality tables are designed to estimate the probability of dying at different ages. For instance, given a 30-year-old male, the mortality table would provide an estimate of his likelihood of passing away within one year based on historical death rates for that age group.
Yearly Probability of Dying vs. Yearly Probability of Living
Yearly probability of dying is often contrasted with its counterpart, the yearly probability of living. While the former estimates the chance of not surviving beyond a given period, the latter calculates the likelihood of still being alive after that same time frame. Understanding both probabilities is crucial for financial planning and risk assessment purposes.
Factors Influencing Mortality Rates: Age, Sex, Tobacco Use, and Long-Term Trends
Age and sex are two primary factors influencing mortality rates and yearly probability of dying calculations. Other significant variables include tobacco use and long-term trends in mortality rates. In the next sections, we will delve deeper into each factor’s impact on mortality rates.
In conclusion, the yearly probability of dying is a vital statistic used to evaluate an individual’s likelihood of passing away within a year, based on their age, sex, and other factors. Mortality tables serve as the foundation for calculating these probabilities, providing valuable insights for various industries and applications. Understanding these concepts can lead to better financial planning, informed decision-making, and overall knowledge about human mortality trends.

Mortality Tables: The Foundation of Yearly Probability of Dying
Mortality tables are a cornerstone in the calculation and understanding of yearly probability of dying. These statistical resources represent the foundation upon which life expectancy estimates, insurance premiums, and annuity pricing are built. Mortality tables, also known as actuarial or life tables, provide crucial information about death rates and survival probabilities for specific groups based on age, sex, and sometimes other factors. Let’s dive deeper into their origin, calculation methods, and applications in the financial and insurance industries.
Origins of Mortality Tables:
Mortality tables have been used since antiquity to estimate death rates and predict future mortality trends. The earliest known use dates back to 1693 when the English Reverend John Graunt published a book, “Natural and Political Observations Made Upon the Bills of Mortality,” which contained detailed records of London’s deaths by age, sex, and cause. However, it was in the late 18th century when French mathematician Pierre-Simon Laplace developed the first life table based on statistical methods. Since then, mortality tables have become essential tools for actuaries, demographers, insurers, and government agencies.
Calculating Mortality Tables:
Mortality tables are generated by analyzing historical data from death records, census information, and vital statistics to estimate the probability of dying within a given time frame, usually one year. This is done by calculating mortality rates or probabilities based on age and sex cohorts. The most widely used mortality tables in the insurance industry are the Commissioners Standard Ordinary (CSO) mortality tables, adopted by the National Association of Insurance Commissioners. These tables differentiate mortality risk by age, sex, and tobacco use.
Uses of Mortality Tables:
Mortality tables play a vital role in estimating yearly probability of dying, setting life insurance premiums, pricing annuities, and determining social security benefits. For instance, insurers use mortality tables to estimate the likelihood of policyholders dying during their coverage term and set premiums accordingly based on that risk assessment. In contrast, annuity providers rely on mortality tables to calculate potential future payouts based on the probability of an individual living through each year of the contract.
Mortality tables are also essential for governments in setting funding targets for pension plans, social security programs, and other welfare schemes. Understanding the implications of these tables can help investors make informed decisions about their financial planning, particularly when considering risk management strategies related to longevity and mortality rates.

Understanding Age-Specific Probabilities of Dying
The yearly probability of dying differs significantly between age groups, with older individuals having a greater likelihood of passing away compared to younger ones. These probabilities can help us understand mortality trends and inform financial planning, particularly for institutional investors like insurance companies and pension funds. In this section, we’ll delve deeper into age-specific probabilities of dying and how they vary from one group to another.
Age-specific Probability of Dying: An Overview
The probability of dying within a year is typically calculated using mortality tables, which divide the number of deaths in a particular age group by the total population size for that age group at the beginning of a period. For instance, according to the Commissioners Standard Ordinary (CSO) mortality tables adopted by the National Association of Insurance Commissioners, a 30-year-old male has approximately a 0.18% chance (or 0.001795 probability) of dying within one year, while a 60-year-old male’s odds rise to around 1.1%. An individual’s age is the most significant factor in determining their yearly probability of dying.
Exploring Age-Specific Probabilities: Examples
The mortality tables below highlight the yearly probabilities of dying for various age groups, illustrating how they change as people grow older.
| Age Group | Yearly Probability of Dying |
| — | — |
| 30 years old | 0.18% (male) / 0.12% (female) |
| 40 years old | 0.35% (male) / 0.20% (female) |
| 50 years old | 0.67% (male) / 0.39% (female) |
| 60 years old | 1.1% (male) / 0.74% (female) |
| 70 years old | 2.5% (male) / 1.5% (female) |
| 80 years old | 5.3% (male) / 3.5% (female) |
| 90 years old | 11.4% (male) / 7.6% (female) |
This table shows a clear trend: the probability of dying increases with age for both males and females, indicating that older populations are inherently riskier from an insurance perspective. It is essential to recognize these trends when setting life insurance premiums or pricing annuities for various investor groups.
In the following sections, we will discuss additional factors like sex, socio-economic status, and lifestyle choices that can further impact yearly probabilities of dying.

Factors Influencing the Yearly Probability of Dying: Sex and Tobacco Use
Understanding how factors like sex and tobacco use impact the yearly probability of dying is essential for both personal and investment decisions.
Sex Differences in Mortality Rates
The human mortality rate varies significantly based on sex, with women generally having a longer life expectancy than men. This difference can be observed across age groups, making it an important factor to consider when calculating yearly probability of dying. For example, according to the Commissioners Standard Ordinary (CSO) mortality tables, a 30-year-old woman has a lower yearly probability of dying compared to a man of the same age: 0.001569% for women versus 0.001795% for men. This trend continues as individuals age, with women’s lower risk extending into older age groups.
The Role of Tobacco Use in Mortality Rates
Tobacco use significantly influences the yearly probability of dying by increasing the likelihood of premature death. The CSO mortality tables reflect this difference in risk for insurers and annuity providers. For instance, a 30-year-old non-smoker has a lower yearly probability of dying than a smoker of the same age: 0.001569% versus 0.002841%. The difference in risk continues to grow as both individuals age.
Smokers, on average, face higher risks at every age and experience lower life expectancy rates compared to non-smokers. For example, a 65-year-old male smoker has an estimated yearly probability of dying that is more than double the risk for a non-smoker of the same age: 0.0278% versus 0.0114%. The implications of these differences are far-reaching, with insurers and governments using mortality tables to calculate premiums, pricing annuities, and funding long-term care programs.
In conclusion, understanding the factors that influence the yearly probability of dying – such as age, sex, and tobacco use – is crucial for making informed financial decisions. These insights can help individuals tailor their investments and insurance products to better meet their unique needs while offering a more comprehensive perspective on this essential statistical measure.
Long-Term Trends in Mortality Rates
Yearly probability of dying estimates are not only essential for the insurance industry but also a valuable tool for researchers, governments, and public health organizations to analyze population trends, assess life expectancy changes, and evaluate the impact of various socioeconomic factors on mortality. Long-term trends in mortality rates provide crucial insights into how the probability of dying changes over time.
Mortality rate data has been collected since the 17th century in Europe and the United States. Initially, life expectancy was low due to high infant mortality rates and frequent epidemics. In 1750, the average life expectancy at birth in England was around 28 years (for males) and 32 years (for females). Since then, significant advancements in medical technology, public health improvements, and socioeconomic progress have led to substantial reductions in mortality rates and increases in life expectancy.
In the late 19th century, the global average life expectancy at birth reached around 45 years for both males and females, thanks to improved sanitation, access to clean water, and vaccines against infectious diseases. During the mid-20th century, it climbed further to approximately 63 years for men and 67 years for women as a result of better nutrition, advances in antibiotics, and reduced infant mortality rates due to improved public health initiatives.
Recent trends show that global life expectancy at birth has continued to increase, reaching over 72 years for men and nearly 78 years for women in 2019. In developed countries like Japan, Switzerland, and Australia, the average lifespan exceeds 84 years.
The steady decline in mortality rates has significantly impacted yearly probability of dying estimates. For instance, a person born in the late 19th century had a much higher chance of dying within their first few years compared to someone born today. Additionally, historical trends show that mortality rates have become more equalized across different age groups and geographic locations due to improvements in overall health and living standards.
Understanding these long-term trends in mortality rates is essential for institutional investors, as it helps them assess the potential risks and opportunities associated with different age cohorts and populations. Additionally, demographic shifts and changes in mortality rates can significantly impact industries like insurance, healthcare, and retirement planning. For example, a growing elderly population may lead to increased demand for healthcare services, long-term care facilities, and annuities.
It is important to note that while historical trends indicate a general trend towards lower mortality rates and longer life expectancy, there are still variations in mortality rates within different populations based on factors such as socioeconomic status, lifestyle choices, education, and geographic location. These factors can have significant impacts on yearly probability of dying estimates and overall population health.
In summary, understanding long-term trends in mortality rates is crucial for institutional investors as it helps them assess risks and opportunities in various industries while gaining insights into the demographic shifts that may influence their investment strategies. By examining historical data and staying informed about current trends, investors can make more informed decisions that account for changing population dynamics and mortality rates.

The Probability of Living: The Flip Side of the Coin
Yearly probability of living is an essential concept complementing its counterpart, the yearly probability of dying. While the latter calculates the likelihood of a person passing away within a given time frame, the former determines their chances of surviving it. This section explores the meaning, calculation, and applications of the yearly probability of living, shedding light on its significance in contrast to the more commonly discussed yearly probability of dying.
Yearly Probability of Living: An Overview
The yearly probability of living (YPL) is an estimation of the likelihood of a person continuing to live for another year based on their age, sex, and other factors. This measure is derived from mortality tables, which record historical death rates among specific population groups over a given period. YPL offers valuable insights into population dynamics, longevity trends, and risk assessment in various industries, such as insurance.
Comparing Yearly Probability of Dying and Living
The relationship between yearly probability of dying (YPD) and yearly probability of living (YPL) is straightforward: YPL equals 100% minus YPD. As we’ve seen earlier, the yearly probability of dying increases with age; thus, the opposite is true for YPL. For instance, a 60-year-old man has an approximate 1.1% chance of dying within a given year (based on US mortality tables), making his survival rate, or YPL, about 98.9%. Conversely, a newborn infant’s YPD is around 0.0035%, resulting in an impressive YPL of approximately 99.9965%.
Applications and Uses of Yearly Probability of Living
Yearly probability of living has significant implications for life insurance and annuity pricing, particularly when assessing the risk associated with long-term contracts or guarantees. In the context of insurance, YPL helps determine the likelihood that policyholders will live through the length of their policies, allowing insurers to set appropriate premiums. Furthermore, it is a crucial factor in calculating longevity risks for pension funds and other retirement plans, where the goal is to ensure that benefits are paid out over extended periods while minimizing the possibility of under- or over-funding.
In conclusion, understanding the yearly probability of living provides valuable insights into demographic trends and risk assessment across various industries. It can be used in conjunction with the yearly probability of dying to gain a more comprehensive perspective on mortality rates and their implications for individuals and society as a whole. This knowledge empowers investors, policymakers, and researchers to make informed decisions based on accurate and reliable data.

Mortality Rates vs. Life Expectancy
Yearly probabilities of dying are often compared to life expectancy, another critical statistic for both individuals and the financial industry. While both concepts are derived from mortality rates, they convey different perspectives on an individual’s lifetime.
Life expectancy is a measure of how long someone is expected to live based on their current age, sex, or other factors. It estimates the average number of years a person in a specific group will continue to live. For instance, if you are 65 years old and your life expectancy is 82, it suggests that the statistical average for people turning 65 years old is expected to live an additional 17 years.
Comparatively, yearly probability of dying estimates a person’s likelihood of passing away within one year. When calculating probabilities of dying, age plays a significant role in determining risk levels. A young adult may have a negligible annual probability of dying, while for an elderly individual, it is much higher. In contrast, the life expectancy remains relatively constant as someone ages, providing a more long-term perspective on mortality risks.
Mortality rates and life expectancy are interrelated: a lower yearly probability of dying corresponds to a longer life expectancy. However, they offer unique insights into individuals’ lifetimes. Yearly probabilities focus on the immediate future, while life expectancies encompass a more extended time horizon.
Both statistics are essential for insurance companies and actuaries when setting premiums or pricing annuities based on an individual’s age and risk factors. They help determine the likelihood of having to pay out claims or provide income streams over several years. Understanding these concepts can also be valuable for investors seeking to make informed financial decisions regarding their investments, retirement plans, and insurance coverage.
By examining yearly probabilities and life expectancies together, individuals gain a more holistic perspective on the various aspects of mortality risks. While there is no denying that everyone will eventually pass away, having insight into these statistical measures helps them better plan for the future.

Applications: Insurance Industry and Government Uses of Yearly Probability of Dying
Yearly probability of dying has significant implications for the insurance industry, particularly when it comes to setting premiums for life insurance policies and pricing annuities. The more accurate the estimates, the better insurers can assess risk and offer competitive rates.
Mortality tables are a crucial tool in this process. They provide a detailed breakdown of death rates based on age, sex, and other factors like tobacco use, education levels, and income. Insurers use these tables to estimate the probability of their policyholders dying within a given period – most commonly one year.
For instance, an insurer might set a higher premium for someone with a history of smoking, based on increased mortality rates associated with tobacco use. Similarly, a young person with a high-risk occupation would pay a higher premium than someone in a safer profession. By factoring in these risk factors, insurers can offer more personalized pricing and ensure that their profits remain steady over time.
The insurance industry isn’t the only one making use of yearly probability of dying estimates. Governments also rely on mortality data to design public policies and programs. For example, the Social Security Administration uses mortality tables to calculate benefits for retirement, disability, and survivor payments. These agencies need accurate mortality rate data to determine eligibility and estimate future costs.
The use of yearly probabilities extends beyond individual policies and government programs. The concept is also important in fields like actuarial science, economics, demography, public health, and more. As our understanding of mortality rates continues to evolve, the role of yearly probability of dying estimates will only grow in importance.
Mortality tables play a key role in calculating both yearly probability of dying and yearly probability of living. By comparing these two measures for different age groups, we can observe trends and patterns that help us better understand demographic shifts and plan accordingly. This information is critical to the financial industry, as well as individuals making long-term investment decisions.
In conclusion, the yearly probability of dying is a valuable statistic used across various industries and disciplines. It provides essential insights into mortality rates and allows for more accurate risk assessment and policy design. Whether you’re an insurer setting premiums or a government planning social programs, understanding this concept can make all the difference in making informed decisions that impact people’s lives.

Mortality Rates and Socio-Economic Factors
Understanding how various socio-economic factors influence mortality rates is crucial when discussing the yearly probability of dying. These factors, such as education, income, lifestyle, and others, significantly impact an individual’s chances of survival and overall health. This section will explore these factors in greater detail.
Education and Mortality Rates
The relationship between education levels and mortality rates has been extensively studied. In general, a higher level of education is associated with lower mortality risks. According to the World Bank, countries with higher literacy rates have lower infant mortality rates and overall lower mortality rates for all age groups. Research shows that the benefits of increased educational attainment extend beyond infancy, with better-educated individuals having a reduced risk of premature death from various causes.
Income and Mortality Rates
The link between income and mortality rates is another well-documented phenomenon. Generally speaking, higher income levels correlate with lower mortality risks. The World Health Organization (WHO) reports that countries with higher Gross National Incomes (GNI) per capita tend to have better overall health outcomes, including lower mortality rates and longer life expectancies.
Lifestyle Factors
Various lifestyle factors, such as smoking, nutrition, exercise habits, and substance use, can significantly affect mortality rates. For instance, tobacco use is one of the leading causes of preventable deaths worldwide, contributing to approximately 6 million deaths each year. Smokers are twice as likely to die prematurely compared to non-smokers. Similarly, dietary choices (such as poor nutrition) and sedentary lifestyles contribute to higher mortality risks. Regular physical activity, a balanced diet, and avoiding harmful substances are all crucial factors in maintaining good health and reducing the probability of premature death.
Government Policies and Mortality Rates
Governments can influence socio-economic conditions that impact mortality rates through various policies and interventions. For example, public health campaigns aimed at promoting healthy behaviors (e.g., smoking cessation programs) or improving access to quality education and healthcare services can help lower mortality risks for their populations. Conversely, policies that exacerbate socio-economic inequalities—such as inadequate public health funding or lax regulations on harmful industries like tobacco—can contribute to higher mortality rates and widen the gap between disadvantaged and more affluent groups.
In conclusion, understanding the role of socio-economic factors in mortality rates is essential when discussing yearly probability of dying. By recognizing how education, income, lifestyle choices, and government policies influence health outcomes, we can begin to develop strategies aimed at reducing preventable deaths and improving overall population wellbeing.

FAQ: Common Questions about the Yearly Probability of Dying
The concept of yearly probability of dying might appear complex at first glance, but it is a valuable statistical tool for understanding mortality and its implications for individuals and organizations. Below, we address some common queries regarding this topic.
**1. How is yearly probability of dying calculated?**
Yearly probability of dying (also called the force of mortality) is estimated using mortality tables, which provide percentages of people in a specific group who are statistically likely to die within a given period, typically one year. Calculations are based on dividing the number of deaths within that group by the number of individuals alive at the start of the period. For example, the chance of a 30-year-old male dying within one year is estimated at around 0.18%, according to mortality tables used in the insurance industry.
**2. Where are yearly probabilities of dying most commonly found?**
Yearly probability of dying estimates are primarily utilized in health studies, the insurance industry, and government programs. They help insurers price policies, including life insurance and annuities, based on the mortality risk of their customers. In the context of government programs, such as Social Security, yearly probabilities of dying serve as an essential component for calculating benefits and estimating future liabilities.
**3. Is there a difference between the probability of dying and the probability of living?**
Yes, these two concepts are related but distinct. Yearly probability of dying represents the likelihood of dying within one year, whereas the yearly probability of living reflects an individual’s probability of surviving another year. Probability of living decreases as age increases while probability of dying rises.
**4. What is a mortality rate? How does it differ from yearly probability of dying?**
Mortality rates represent the number of deaths as a percentage of a total population within a given period, typically one year. The crude mortality rate is the most basic measure and doesn’t differentiate between genders or other factors. Mortality rates can also be age-specific, sex-specific, race-specific, cause-specific, and more. Yearly probability of dying provides additional insights into an individual’s likelihood of passing away within a specific time frame, whereas mortality rates provide a more general snapshot of population health.
**5. What is life expectancy? How does it connect to yearly probability of dying?**
Life expectancy represents the estimated number of years someone with certain characteristics, such as age and sex, is likely to live or reach before passing away. Life expectancy estimates are derived from mortality data and can vary based on factors like income, education, and lifestyle choices. Yearly probability of dying and life expectancy are related concepts, as a decrease in the former implies an increase in the latter.
In conclusion, understanding yearly probability of dying and its implications is crucial for individuals seeking to navigate financial planning, insurance, health studies, or government programs that deal with mortality risk. By exploring this topic through FAQs and subtopics such as mortality tables, age-specific probabilities, and factors like sex and tobacco use, you can gain a deeper understanding of its significance in the realm of finance and investment.
 Next entry · No. 5,847The Yearly Probability of Living: A Crucial Statistical Measure for Insurance Underwriting and Planning
See also
-
 No. 5,188
18 Aug 2025
20 min
Understanding Underlying Mortality Assumptions: The Key Factor in Life Expectancy and Insurance Pricing
Insurance
No. 5,188
18 Aug 2025
20 min
Understanding Underlying Mortality Assumptions: The Key Factor in Life Expectancy and Insurance Pricing
Insurance -
 No. 5,233
22 Aug 2025
22 min
Understanding Unfair Trade Practices: A Comprehensive Guide for Institutional Investors
Business Finance
No. 5,233
22 Aug 2025
22 min
Understanding Unfair Trade Practices: A Comprehensive Guide for Institutional Investors
Business Finance -
 No. 5,208
20 Aug 2025
21 min
Understanding Underwriting Expenses in Finance: A Comprehensive Guide for Institutional Investors
Business Finance
No. 5,208
20 Aug 2025
21 min
Understanding Underwriting Expenses in Finance: A Comprehensive Guide for Institutional Investors
Business Finance -
 No. 3,930
08 May 2025
19 min
Understanding Projected Benefit Obligations (PBO): Measuring Future Pension Liabilities for Institutional Investors
Business Finance
No. 3,930
08 May 2025
19 min
Understanding Projected Benefit Obligations (PBO): Measuring Future Pension Liabilities for Institutional Investors
Business Finance -
 No. 3,854
02 May 2025
19 min
Understanding an Overfunded Pension Plan: A Comprehensive Guide for Institutional Investors
Business Finance
No. 3,854
02 May 2025
19 min
Understanding an Overfunded Pension Plan: A Comprehensive Guide for Institutional Investors
Business Finance -
 No. 3,264
14 Mar 2025
22 min
Understanding Moral Hazard: Risks and Implications in Finance and Investing
Business Finance
No. 3,264
14 Mar 2025
22 min
Understanding Moral Hazard: Risks and Implications in Finance and Investing
Business Finance