Understanding VWAP Cross: An Essential Trendline for Institutional Investors

Discover the significance of a VWAP cross for institutional investors, including its calculation, factors influencing it, buy/sell signals, practical…
What is a VWAP Cross?
A VWAP cross represents a significant moment in trading when the current market price of a security intersects with its Volume-Weighted Average Price (VWAP). This event can provide valuable insights for traders by highlighting shifts in both price and volume dynamics. To understand this concept, let’s delve into the definition and calculation of VWAP, followed by its significance as a buy or sell signal indicator.
Definition of VWAP:
Volume-Weighted Average Price (VWAP) is an essential trendline for traders seeking to analyze the relationship between volume and price in their securities. Calculating this trendline involves determining the average price at which a particular security has been traded over a specific period. However, unlike traditional moving averages that calculate the simple mean of a stock’s closing prices, VWAP takes into account both volume and price to create a more accurate representation of the stock’s value in relation to its buyers and sellers.
The VWAP calculation formula is as follows:
VWAP = (Total Dollars Traded) / (Total Volume)
This formula is based on the total dollars spent on securities divided by the total number of shares traded during a specified time frame. By calculating VWAP, traders can analyze how volume impacts price and create trendlines that help identify buy or sell opportunities based on changes in price and volume dynamics.
The Significance of VWAP Cross:
VWAP cross signals occur when the current market price intersects with a previously established VWAP trendline. These crosses can be crucial for traders seeking to capitalize on shifts in the security’s volume or price behavior. A bullish buy signal is generated when the security’s price surges above its VWAP line, indicating that buyers are entering the market in large quantities. Conversely, a bearish sell signal emerges when the security’s price falls below its VWAP, suggesting that sellers are exiting the market in mass.
The significance of VWAP cross signals is rooted in their ability to highlight potential shifts in supply and demand dynamics for a particular security, providing traders with valuable information to inform their investment decisions. In the next sections, we will explore the factors influencing VWAP trendlines, as well as how these signals can be used in both short-term and long-term trading strategies. Stay tuned!

VWAP Calculation and Charting
A VWAP cross is an intriguing trading indicator that occurs when a security’s price intersects its Volume-Weighted Average Price (VWAP). To delve into this concept, we must first comprehend how the VWAP is calculated and visualized through charting.
Calculating VWAP
The VWAP is a moving average trendline that incorporates both volume and price data to provide traders with insightful information about a security’s trading behavior. The formula for calculating VWAP is as follows:
VWAP = (Total Volume × Average Price) / Total Shares Bought
This calculation takes into account the total volume traded during a specified time frame, and the average price at which these shares were bought. By dividing the product of the two by the number of shares bought, we obtain the VWAP for that given period.
Visualizing VWAP
The VWAP is typically plotted as a line chart or a trendline on a candlestick chart to help traders analyze price movements in relation to volume-weighted averages. This allows traders to visually assess the impact of volume changes on prices and identify potential trends, support, and resistance levels.
VWAP Cross Signals
A VWAP cross occurs when a security’s current price intersects with its VWAP line. A bullish buy signal is generated if the security’s price rises above its VWAP, indicating that the buying pressure exceeds selling pressure and the security is expected to continue its upward trend. Conversely, a bearish sell signal emerges when the price falls below the VWAP, suggesting that the selling pressure has overtaken buying pressure and the security is more likely to decline.
Volume’s Role in VWAP
Understanding how volume influences VWAP cross signals is crucial for successful trading decisions. By closely monitoring changes in volume and price, traders can make informed decisions on potential buy or sell opportunities. When the VWAP line crosses over a security’s candlestick chart, it provides valuable information about the underlying buying and selling pressure influencing the security’s price movement.
Utilizing VWAP for Short-Term and Long-Term Trading
Institutional investors can employ VWAP as an essential tool to gain insights into short-term and long-term trading strategies. The versatility of this indicator lies in its ability to reveal trends and potential entry or exit points based on volume-weighted average price analysis. Additionally, traders can customize their approach by using different time frames to cater to their investment goals.
Comparing VWAP Cross to Other Indicators
While the VWAP cross is an effective indicator in its own right, it’s important to recognize its strengths and limitations when compared to other popular indicators like moving averages or Bollinger bands. Understanding the unique advantages of each indicator helps traders tailor their strategies to various market conditions.
In conclusion, mastering the intricacies of VWAP calculation and charting is an invaluable skill for institutional investors looking to gain a competitive edge in the ever-evolving financial markets. By closely observing volume-weighted average price trends and deciphering the implications of VWAP cross signals, traders can make informed decisions on buy and sell opportunities that may not be evident through traditional methods.

Factors Influencing a VWAP Trendline
A VWAP trendline is an essential tool for institutional investors, as it helps them to better understand the relationship between a security’s price and its volume-weighted average price (VWAP). The significance of a VWAP cross occurs when a security’s price intersects with this critical trendline.
To grasp the concept of a VWAP trendline, it is essential to comprehend how it is calculated. VWAP is derived from the following formula:
VWAP = (Total Dollar Value of Shares Bought / Total Number of Shares Bought)
This calculation takes into account both volume and price. In simpler terms, VWAP represents the average price a security trades at based on the total dollar value of shares bought during a specific time frame. It is not merely an arithmetic mean but rather a weighted average that puts greater emphasis on larger transactions.
The role of volume in VWAP becomes crucial when examining this trendline. If significant buying or selling pressure influences the market, it will naturally result in increased trading volumes. This heightened volume then affects the price action and subsequently impacts the VWAP trendline. As a result, understanding the relationship between volume and VWAP is essential to deciphering potential buy and sell signals.
A rising volume-weighted average price trendline can be indicative of a security that is gaining interest from investors. Conversely, a declining VWAP trendline may signal weakness in a security. The significance of this trendline lies within its ability to help traders differentiate between genuine price movements and temporary fluctuations.
In conclusion, the factors influencing a VWAP trendline are volume and price, with volume having a more substantial impact due to its influence on the weighted average calculation. As investors closely follow these trends, they can use this information to make informed decisions regarding their trading strategies, ultimately helping them stay ahead of market shifts.
VWAP as a Buy Signal Indicator
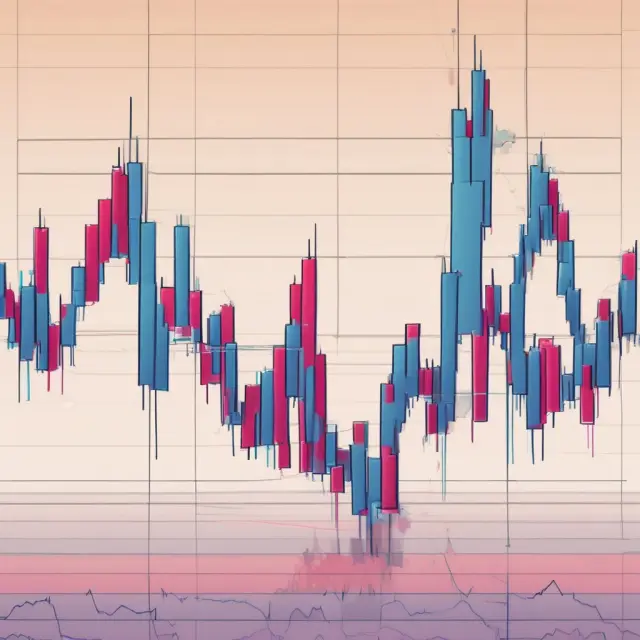
A VWAP cross is an intriguing trendline signal for traders, particularly when it comes to detecting bullish buy signals. This phenomenon occurs when the security’s current market price intersects with its Volume-Weighted Average Price (VWAP). To better understand this concept, let’s first examine how VWAP is calculated and visualized through charting.
VWAP Calculation
The calculation of a security’s VWAP involves determining the average price at which all shares have been bought over a given time period. It considers both the volume of shares traded and their respective prices. The formula for calculating VWAP is: VWAP = [Total Volume × Average Price] / Total Dollars Spent
VWAP Charting
Traders can visualize VWAP through charting by comparing it to a security’s daily candlestick pattern. When the security’s price line crosses over its VWAP trendline, a VWAP cross occurs. This intersection can be considered analogous to traditional resistance and support lines. In a VWAP chart, this line is plotted as a single trendline on a candlestick chart.
Buy Signals
When a security’s price trend is below its support level, an increase in both volume and price could potentially create a bullish buy signal. The VWAP will react to these changes by spiking significantly, crossing over the current price. This situation highlights a potential buying opportunity for traders. A rapid increase in volume and price together can indicate that a trend reversal is underway, making it an attractive entry point for long positions.
VWAP Cross Significance
The importance of understanding VWAP crosses lies in their ability to provide early indications of potential shifts in market trends. Traders following this pattern can potentially gain an edge in the market by recognizing and acting upon these signals before broader price movements become apparent. By using a VWAP trendline, traders can identify changes in volume and price dynamics that may not yet be fully reflected in the security’s short-term or long-term price.
VWAP as a Sell Signal Indicator
A VWAP cross is an important tool for traders seeking to identify bearish sell signals in securities. By closely monitoring a security’s volume-weighted average price (VWAP) and its market price, traders can identify potential sell opportunities when the two intersect.
Understanding VWAP Cross Signals
A bearish VWAP cross occurs when the security’s price falls below its VWAP trendline. This signals that the security is trading at a discount to its VWAP and may be poised for further declines. Conversely, if a security’s price rises above its VWAP trendline, it could indicate a potential bullish buy signal (as previously discussed in our section on “VWAP as a Buy Signal Indicator”).
Visualizing Volume’s Impact
Volume plays an essential role in the interpretation of VWAP cross signals. A significant increase in volume during a bearish cross can strengthen the sell signal. Conversely, a small increase in volume may not be sufficient to validate a sell signal. Traders should monitor both volume and price when interpreting VWAP crosses.
VWAP Cross Example
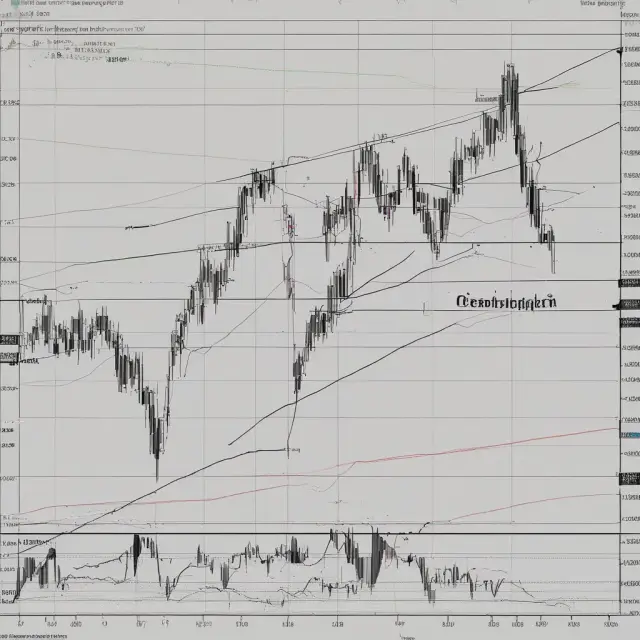
Consider the chart below showing a hypothetical security’s daily closing prices (black line) and its corresponding VWAP trendline (red line):
In this example, the security experiences a bearish cross when its price falls below the VWAP trendline, signaling a potential sell opportunity for traders. However, before executing any trades, it’s important to consider other factors, such as market conditions and news, that may impact the security’s price movements.
VWAP Cross Strategy
Traders using a VWAP cross strategy should be prepared for false signals or whipsaws. This means that there may be instances where a potential buy or sell signal does not materialize following a VWAP cross. To minimize these occurrences, traders can use multiple timeframes and consider other indicators in conjunction with the VWAP trendline. Additionally, setting clear entry and exit points based on risk tolerance can help mitigate losses from false signals.
In conclusion, understanding bearish sell signals generated by a VWAP cross is an essential part of utilizing this popular trading indicator for profit opportunities. By closely monitoring volume and price in relation to the VWAP trendline, traders can make informed decisions and potentially capitalize on market trends. Remember that no strategy is foolproof; it’s essential to apply a disciplined approach with proper risk management when implementing any trading strategy.
Understanding the Importance of Volume in VWAP
A VWAP cross occurs when a security’s price intersects its volume-weighted average price (VWAP). This trading indicator provides valuable information for investors and traders by showcasing the influence of volume on a security’s price trend. To fully grasp the significance of a VWAP cross, it is crucial to understand how this essential trendline is calculated and visualized through charting.
Calculating VWAP
VWAP is derived from dividing the total value of shares bought by the volume-weighted average price (VWAP) during a specific period. The formula for calculating VWAP is as follows:
VWAP = [Total Dollars Spent on Shares Bought] / [Total Volume]
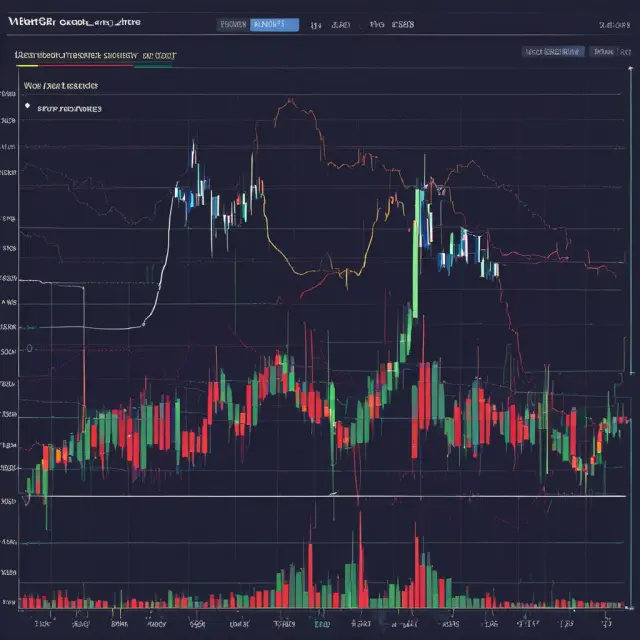
Volume plays an essential role in determining the price of the VWAP line. In turn, changes in volume can significantly impact the trendline and trigger buy or sell signals for traders.
Visualizing VWAP through Charting
The calculation of VWAP is displayed as a moving average line on a security’s chart. The line is referred to as the VWAP trendline or VWAP line, which can be visualized in relation to the security’s candlestick pattern. When the VWAP crosses the price bar, it generates a potential buy or sell signal depending on the direction of the crossing.
Impact of Volume and Price on VWAP Trendline
The interaction between volume and price influences VWAP trendlines. By examining VWAP trendlines and their corresponding price bars, traders can identify shifts in market sentiment that may not be immediately evident from traditional price charts alone. This information allows investors to make informed decisions about when to enter or exit positions based on emerging trends within the security’s price movement.
Bullish Buy Signals
A bullish buy signal occurs when a security’s price trend is below its VWAP line, and there is an increase in both volume and price that causes the VWAP line to cross over the current price. This signals the potential for a significant upward price movement in the security.
Bearish Sell Signals
Conversely, if VWAP has been trending above a security’s candlestick pattern and then experiences a sharp decline, the VWAP line may cross below the current price, generating a bearish sell signal. This indicates that the security is expected to trend lower following the cross pattern.
In summary, understanding the importance of volume in VWAP trends can significantly enhance a trader’s ability to detect shifts in market sentiment and make informed decisions based on emerging trends within a security’s price movement. The VWAP cross indicator provides valuable information that complements traditional charting techniques, making it an essential tool for both short-term and long-term trading strategies.

Utilizing VWAP for Short-Term and Long-Term Trading
A Volume-Weighted Average Price (VWAP) cross is a valuable trendline that institutional investors can use in both their short-term and long-term trading strategies. Understanding the significance of VWAP and how it reacts to price movements can offer investors an edge when navigating the market.
The VWAP calculation takes into account both volume and price, making it a comprehensive indicator for assessing market trends. VWAP is calculated by dividing the total value of all shares bought by the total dollar amount spent on those shares. For instance, if a trader buys 100 shares at $50 each and 50 shares at $60 each, their VWAP would be ($50 * 100 + $60 * 50) / (100 + 50), which equals $54.
In a short-term trading context, a VWAP cross signal can indicate an imminent price change when the security’s current price crosses over its VWAP trendline. If the price is trending below its support level and experiences a rapid increase in volume and price simultaneously, the VWAP line will likely spike significantly, crossing above the security’s current price, signaling a potential bullish buy signal.
Long-term investors can also benefit from tracking VWAP crosses as they can help determine significant support and resistance levels in the market. For example, if a security consistently trades near its VWAP line for an extended period, it may be considered a strong support level. Conversely, if the price breaks below the VWAP trendline over multiple periods, it could indicate a bearish sell signal as the security may be expected to trend lower following the cross pattern.
The importance of volume in VWAP cannot be understated. Volume is a critical factor that can influence the accuracy and reliability of this indicator. Analyzing volume trends alongside price movements through VWAP can help traders better understand the underlying market dynamics and make more informed decisions. By using various trading strategies like moving averages and momentum indicators in conjunction with VWAP, investors can increase their chances of success and minimize potential risks.
In conclusion, a VWAP cross signal offers institutional investors valuable insights when implementing both short-term and long-term investment strategies. It is essential to stay informed about the underlying factors influencing VWAP, such as volume and price, in order to accurately interpret VWAP crossing patterns and make confident trading decisions. By incorporating this indicator into their analysis, investors can gain a competitive edge by reacting to market trends earlier than their competitors.
VWAP Cross in Comparison to Other Indicators
A VWAP cross, or Volume-Weighted Average Price cross, is a unique and powerful indicator that sets it apart from other technical indicators by focusing on the relationship between volume and average price. While many common indicators like moving averages, Relative Strength Index (RSI), or Moving Average Convergence Divergence (MACD) analyze trends based on historical price data, a VWAP cross takes a more holistic view of trading dynamics by incorporating volume into the equation.
When comparing VWAP cross with other indicators, it’s crucial to understand their respective strengths and weaknesses:
1. Moving Averages: Traditional moving averages, such as Simple Moving Average (SMA) or Exponential Moving Average (EMA), are based on the simple calculation of a security’s past price data. While they can provide valuable insights into long-term trends and support levels, they do not consider volume’s impact on these trends.
2. Relative Strength Index (RSI): The RSI is an oscillator that measures the strength of a security’s recent price action by comparing gains to losses over a defined period. Although it can effectively identify potential overbought or oversold conditions, it does not factor in volume and may generate false signals during strong market trends.
3. Moving Average Convergence Divergence (MACD): MACD, like RSI, is an oscillator that uses moving averages to gauge momentum shifts. While MACD can be effective for confirming trend direction and identifying potential reversals, it doesn’t provide information about volume dynamics or market sentiment.
In contrast, VWAP cross offers several advantages when analyzing trends:
1. Volume-Weighted Analysis: A VWAP cross takes into account both the average price of a security and its trading volume. By examining the relationship between these two elements, it can help traders determine the overall strength of a trend and identify significant shifts in market sentiment.
2. Trendline Signals: As mentioned earlier, a VWAP trendline can act as a support or resistance level depending on whether it is above or below the security’s price chart. A VWAP cross occurs when the security’s price intersects this line, providing valuable buy and sell signals based on volume dynamics and market sentiment.
3. Continuous Monitoring: Unlike other indicators that may require a specific configuration or threshold to trigger an alert, a VWAP cross allows traders to monitor trends and potential buy/sell signals continuously. This makes it an invaluable tool for active traders seeking to capitalize on short-term market movements.
When using a VWAP cross strategy, it is essential to understand the impact of volume on this indicator. Volume plays a crucial role in setting the direction of price and can significantly influence VWAP trendlines. In the next section, we will dive deeper into the relationship between volume and VWAP cross signals.

Practical Applications of VWAP Cross for Institutional Investors
VWAP cross is an intriguing trendline for institutional investors, as it offers unique insights and potential buy and sell signals based on the interplay between volume and price. In this section, we’ll dive deeper into how VWAP cross can be utilized in the investment strategies of large institutions.
First, let us consider the practical implications when a security’s VWAP trendline crosses above its current price. This bullish scenario is characterized by an increased volume and a corresponding rise in price that propels the VWAP line to surpass the security’s current price. Institutional investors might interpret this as a buy signal, suggesting that the security may be experiencing significant demand or a shift in market sentiment. As a result, they could consider entering long positions when a VWAP cross occurs above the current price.
Conversely, a bearish scenario emerges when the security’s VWAP line falls below its current price, marking a potential sell signal. This situation can occur due to a decrease in demand or an increase in selling pressure. Institutional investors may interpret this as a sign that it’s time to exit their positions or sell short, anticipating further downward movement in the security’s price following the cross pattern.
Institutional investors can also apply VWAP cross analysis on a larger scale by considering intraday and daily chart trends. Intraday VWAP crosses may provide quicker entry and exit opportunities, while daily chart trends offer long-term insights into underlying market trends. For example, an institutional investor might employ daily VWAP crosses to identify trend reversals or potential entries and exits for larger positions.
The power of VWAP cross lies in its ability to provide insights into the interplay between volume and price, which can offer valuable information that is not readily apparent from traditional technical analysis tools. As institutional investors grapple with large orders, analyzing VWAP trends can help them make more informed decisions based on real-time data and market sentiment.
However, it’s important to note that like any other trendline or indicator, VWAP cross is not foolproof and should be used in conjunction with multiple sources of information and analysis. Additionally, institutions must also consider the specific context of their trades (e.g., sector conditions, market volatility, etc.) when interpreting VWAP cross signals.

Common Challenges and Risks when Utilizing VWAP
Although VWAP is an essential tool for institutional investors, it does come with its challenges and potential risks. Let’s discuss some common hurdles that traders might encounter when implementing a VWAP cross strategy.
1. Data Collection and Calculation
Collecting accurate data for volume and prices is critical for calculating the VWAP. Manual data collection can be time-consuming and prone to human error. Automated systems are more efficient but may not capture all intraday price movements accurately. Moreover, the accuracy of the historical VWAP relies on the reliability and completeness of the available historical data.
2. Intraday Price Fluctuations
VWAP is a moving average trendline; it lags behind current prices due to its calculation methodology. This can make it challenging for traders to act on buy or sell signals promptly, especially in rapidly changing markets with high volatility. As a result, a significant price movement occurring before the VWAP cross might cause traders to miss an opportunity if they heavily rely on VWAP as their sole indicator.
3. Multiple Securities and Asset Classes
Analyzing multiple securities or asset classes at once can be overwhelming for traders. Each security has unique characteristics, such as varying trade sizes and volatility. For this reason, investors might choose to focus on a limited number of securities or assets when utilizing VWAP cross analysis.
4. Market Manipulation and False Signals
VWAP is a popular indicator among institutional investors, making it an attractive target for market manipulators. They can potentially create false buy or sell signals by artificially influencing the volume of a security, distorting the VWAP trendline. This can lead to incorrect trading decisions if not closely monitored.
5. Costs and Complexity
VWAP calculation requires intraday data on both price and volume for each security being analyzed. Collecting such data comes with costs associated with data providers, subscriptions or internal resources dedicated to this task. Additionally, VWAP can be a complex tool that involves understanding various concepts like volume-weighted moving averages and trendline analysis.
Addressing these challenges and risks requires diligent preparation and risk management strategies. Ensuring the accuracy of data collection is crucial to minimize errors and maintain confidence in trading decisions based on VWAP. Additionally, keeping up-to-date with market developments and monitoring multiple indicators alongside VWAP can help mitigate false signals and reduce reliance on any single indicator.
 Next entry · No. 5,559Understanding the Volume-Weighted Average Price (VWAP) in Finance and Investment: A Comprehensive Guide for Institutional Traders
See also
-
 No. 3,941
09 May 2025
17 min
Understanding Pennants: A Technical Analysis Continuation Pattern
Financial Education
No. 3,941
09 May 2025
17 min
Understanding Pennants: A Technical Analysis Continuation Pattern
Financial Education -
 No. 3,807
28 Apr 2025
19 min
Understanding the Oscillator of Moving Average (OsMA): A Comprehensive Guide for Institutional Investors
Financial Data Analysis
No. 3,807
28 Apr 2025
19 min
Understanding the Oscillator of Moving Average (OsMA): A Comprehensive Guide for Institutional Investors
Financial Data Analysis -
 No. 2,669
25 Jan 2025
18 min
Understanding the Kairi Relative Index (KRI): A Technical Analysis Tool for Buy and Sell Signals
Financial Tools
No. 2,669
25 Jan 2025
18 min
Understanding the Kairi Relative Index (KRI): A Technical Analysis Tool for Buy and Sell Signals
Financial Tools -
 No. 5,921
18 Oct 2025
20 min
Understanding Zomma: A Third-Order Risk Measure for Derivative Investors
Finance Policy
No. 5,921
18 Oct 2025
20 min
Understanding Zomma: A Third-Order Risk Measure for Derivative Investors
Finance Policy -
 No. 5,792
08 Oct 2025
17 min
Understanding Working Ratio: A Key Financial Ratio for Institutional Investors
Finance Policy
No. 5,792
08 Oct 2025
17 min
Understanding Working Ratio: A Key Financial Ratio for Institutional Investors
Finance Policy -
 No. 5,460
10 Sep 2025
23 min
Understanding Vega Neutral in Options Trading: A Comprehensive Guide
Finance Policy
No. 5,460
10 Sep 2025
23 min
Understanding Vega Neutral in Options Trading: A Comprehensive Guide
Finance Policy