Understanding Lagging Indicators in Finance and Investment: Confirming Economic Trends

Explore the importance of lagging indicators in finance and investment, confirming economic trends. Examples include unemployment rate, corporate profits…
What are Lagging Indicators?
Lagging indicators represent observable or measurable factors that reflect the impact of past events on an economy, business, or investment environment. Unlike leading indicators, which provide insights into future economic activity and trends, lagging indicators confirm trends and changes that have already occurred. This information is crucial for understanding the overall health and direction of the economy, making informed business decisions, and adjusting investment strategies accordingly.
One significant aspect of lagging indicators lies in their confirmation power. While leading indicators may provide early warnings or signals about economic shifts, lagging indicators provide solid evidence that a change has taken place. In many cases, volatility in leading indicators can lead to false positives, making it essential to rely on lagging indicators for accurate trend analysis.
A range of financial and economic factors can serve as lagging indicators, depending on the context. These include:
1. Lagging Economic Indicators: Measured against other economic variables or indices, lagging indicators help confirm the direction and extent of macroeconomic shifts. The unemployment rate, corporate profits, labor costs, and interest rates are some examples of commonly used lagging economic indicators.
2. Lagging Business Indicators: Within a business context, lagging indicators function as key performance indicators (KPIs) to reflect past performance and the impact of previous management decisions or strategies. Sales, customer satisfaction, revenue churn, gross domestic product (GDP), and the consumer price index (CPI) are some examples of common lagging business indicators.
3. Lagging Technical Indicators: In finance and investment, technical indicators that follow rather than lead price action can be useful for confirming trends or identifying potential buying or selling opportunities. Moving averages, moving average convergence divergence (MACD), and other momentum-based indicators are examples of lagging technical indicators.
Understanding the role and significance of lagging indicators is vital to making informed decisions in finance, economics, and business. In the following sections, we will explore various aspects of lagging indicators, including their characteristics, specific examples, and their application in different contexts.

Characteristics of Lagging Indicators
Lagging indicators represent a valuable tool for financial analysts and investors by providing confirmation on the direction of the economy or market trends. Unlike their leading counterparts, which offer early signals on economic changes, lagging indicators reveal trends after they have occurred. This section explores the defining factors that separate lagging indicators from other types of data points, shedding light on how they contribute to economic analysis and investment strategies.
Definition and Timing
A lagging indicator is a crucial economic or financial metric that reveals a trend’s direction after it has already taken place. It helps confirm the validity of the trend by showing its impact on various aspects of the economy, businesses, and financial markets. As such, these indicators are valuable in both economic forecasting and assessing the performance of companies.
Distinguishing Factors between Leading and Lagging Indicators
The primary difference between leading and lagging indicators lies in their ability to predict future trends versus confirming those that have already occurred. While leading indicators provide early signals about potential economic shifts, lagging indicators follow these changes and offer confirmation that a trend is underway. This duality in data presentation provides investors, analysts, and policymakers with a comprehensive understanding of the economy’s direction and trends.
Examples and Economic Significance
Some well-known economic lagging indicators include the unemployment rate, corporate profits, labor costs, average duration of unemployment, and interest rates. For instance, rising unemployment signifies an economic slowdown or recession, as businesses reduce their workforces in response to shrinking demand or declining sales. Similarly, a decrease in corporate profits can serve as a lagging confirmation that the economy has entered a downturn.
Investment Implications and Uses in Business Strategies
Lagging indicators can provide valuable insights for investors by helping them confirm trends in asset prices and economic conditions. For example, an investor may use a moving average to identify a long-term trend and then utilize a lagging technical indicator such as the Relative Strength Index (RSI) or Moving Average Convergence Divergence (MACD) to confirm its strength and consistency.
Businesses can also benefit from lagging indicators in their performance analysis by monitoring key performance indicators (KPIs). These indicators can help businesses assess the impact of previous management decisions and strategies on operational and financial results, allowing them to make more informed decisions moving forward. By tracking both leading and lagging indicators, organizations gain a well-rounded perspective on their business environment and performance.
Stay tuned for our upcoming sections discussing specific examples of economic lagging indicators, such as the unemployment rate and corporate profits.

Examples of Economic Lagging Indicators
Lagging indicators are financial signs that follow rather than precede significant shifts and trends in the economy or business operations. While they may not be as predictive as leading indicators, lagging indicators can help confirm economic trends and provide valuable insights for investors and businesses alike. In this section, we will discuss specific economic indicators commonly classified as lagging indicators, providing examples of their role in confirming long-term economic shifts.
The U.S. Conference Board publishes a monthly index of lagging indicators, which includes various observable factors that change following significant movements in the economy. Some general examples of lagging indicators include:
- Unemployment Rate
- Corporate profits
- Labor Cost per Unit of Output
- Average duration of unemployment
- Interest Rates
- Gross Domestic Product (GDP)
- The Consumer Price Index (CPI)
- Balance of Trade (BOT)
Let’s examine each indicator in more detail to understand their role as lagging indicators:
1. Unemployment Rate: The unemployment rate is a widely-followed measure of labor market conditions, which generally lags changes in the economy. While leading indicators like initial jobless claims may signal upcoming shifts in employment levels, the unemployment rate provides confirmation once these trends have been established. An increase or decrease in the unemployment rate can inform businesses and investors about the overall health of the economy and labor market conditions.
2. Corporate profits: Profits earned by corporations are a crucial aspect of economic activity. While changes in corporate profits do not lead economic cycles, they tend to follow business cycle peaks and troughs. Companies’ profitability is influenced by various factors such as production costs, sales volumes, interest rates, taxes, and government policies. Corporate profits act as essential indicators for businesses and investors to gauge the overall health of the economy and identify trends in specific industries or sectors.
3. Labor Cost per Unit of Output: Labor cost per unit is an essential measure for understanding production costs. While wages and salaries may change before labor productivity, labor cost per unit confirms how the cost of labor has impacted businesses and their ability to produce goods or services efficiently. By monitoring this indicator, firms can better understand their competitive position, adjust their pricing strategies, and manage labor expenses accordingly.
4. Average Duration of Unemployment: The average duration of unemployment is a lagging indicator that provides insight into the severity and persistence of unemployment following economic downturns or recessions. As businesses begin to recover from an economic slump, new jobs are created, but it can take time for workers to find employment, especially those with longer tenures of unemployment. By monitoring this indicator, policymakers, economists, and businesses can gain valuable information about the state of labor markets and the pace of economic recovery.
5. Interest Rates: Central banks set interest rates based on various factors, including inflation, economic growth, and financial stability concerns. Interest rate decisions generally follow changes in the economy rather than lead them. When the economy is expanding, central banks may gradually increase interest rates to prevent inflation from getting out of hand. Conversely, when the economy is contracting, interest rates may be lowered to stimulate borrowing and investment. As lagging indicators, interest rates can provide valuable insights into past economic conditions, helping businesses and investors make informed decisions about their strategies and investments.
6. Gross Domishit Product (GDP): While GDP growth may not lead an economic recovery, it is still a crucial lagging indicator that helps confirm the trend. Once GDP growth starts to pick up, it indicates that other indicators, such as employment levels and consumer spending, will also follow suit. This can provide businesses with a sense of optimism about the future and help guide their decision-making process.
7. Consumer Price Index (CPI): The CPI measures changes in prices for a basket of goods and services, providing valuable insights into inflation trends. While changes in producer prices or commodity prices may precede movements in the CPI, it is still considered a lagging indicator due to its focus on final consumer prices. By monitoring CPI trends, businesses and investors can determine how inflation impacts their costs and pricing strategies.
8. Balance of Trade (BOT): The balance of trade measures the difference between a country’s exports and imports of goods and services over a specified period. While changes in trade flows may precede shifts in the balance of trade, this indicator confirms the overall trend. A persistent trade deficit or surplus can impact economic conditions and currency valuations, making it essential for businesses to monitor this lagging indicator closely.
In summary, understanding lagging indicators is crucial for investors and businesses because they confirm trends in the economy and provide valuable insights into past economic conditions. By examining specific examples of lagging indicators like unemployment rate, corporate profits, labor cost per unit of output, average duration of unemployment, interest rates, GDP, CPI, and BOT, we can better understand their role in guiding decision-making and managing risk.

Unemployment Rate as a Lagging Indicator
The unemployment rate is one of the most popular and commonly used lagging economic indicators. It is calculated by dividing the number of unemployed individuals by the labor force, expressed as a percentage. The unemployment rate is typically released monthly by the U.S. Bureau of Labor Statistics and serves as an indicator of the overall health and direction of the labor market in an economy.
A significant change in the unemployment rate generally signifies that a trend has already occurred within the labor market. For example, if the unemployment rate starts to rise, it suggests that employers have begun reducing their workforce due to economic downturns, weak demand, or other factors that negatively impact hiring. Conversely, when the unemployment rate begins to decline, it usually indicates that a period of economic expansion is underway, with businesses increasing their workforce and adding jobs.
The unemployment rate can be viewed as a lagging indicator because it captures past employment trends. It takes time for the labor market to respond to changes in economic conditions, making it an essential tool in confirming long-term shifts in the economy. As such, it provides valuable information for policymakers, investors, and analysts seeking to understand the underlying state of the economy.
Understanding the relationship between unemployment and other economic indicators is crucial in analyzing the economy’s overall health. For example, while the unemployment rate is a lagging indicator, it can also be influenced by leading indicators such as consumer confidence, industrial production, and housing starts. These factors can provide insights into the future direction of the labor market based on their trends.
The unemployment rate’s significance extends beyond its role in economic analysis. It can also impact businesses and investors when evaluating performance or making investment decisions. For instance, a company operating within an industry experiencing high unemployment may face challenges recruiting skilled workers, while industries with low unemployment rates can potentially benefit from increased labor availability. Similarly, investors looking to allocate capital may use the unemployment rate as a factor in their decision-making process to identify economies or sectors with strong labor market trends.
In conclusion, the unemployment rate is an essential lagging indicator that offers valuable insights into the current state and historical trends of the labor market. Its confirmation of underlying economic shifts makes it a crucial tool for policymakers, businesses, and investors seeking to make informed decisions in response to changing economic conditions.

Corporate Profits as a Lagging Indicator
One crucial economic lagging indicator is corporate profits, which reflect the collective earnings of businesses within an economy. Corporate profits provide insight into how much income companies have generated from their operations and can reveal trends related to business conditions and economic health.
Unlike leading indicators, such as consumer confidence or housing starts, which often anticipate or predate changes in the economy, lagging indicators like corporate profits confirm economic shifts that have already taken place. This makes them valuable tools for understanding long-term trends and assessing the overall economic climate.
Corporate profits can be analyzed in several ways, including:
- National income accounts – These provide comprehensive data on corporations’ total earnings before interest, taxes, and depreciation (EBIT).
- Corporate profit margins – The difference between a company’s revenues and its costs of production is called the corporate profit margin. This metric can reveal trends in companies’ pricing power and overall economic conditions.
- Sectoral analysis – Studying profits by industry sector can help investors understand how various sectors are contributing to the economy.
- Comparison with Gross Domestic Product (GDP) – Analyzing corporate profits relative to GDP provides context on the economy’s overall health and businesses’ earnings potential.
Corporate profits are influenced by several factors, including changes in sales volume, input costs, taxes, and financial markets conditions. Understanding these influences can help investors assess how profitable companies will remain in the future and evaluate their investment strategies accordingly.
It is essential to note that corporate profits can be volatile and subject to short-term fluctuations due to various economic factors. Therefore, it is crucial to analyze trends over longer periods rather than relying solely on single data points. This analysis can reveal shifts in business conditions and provide insight into the broader economic landscape.
In summary, corporate profits serve as a critical lagging indicator for understanding long-term trends in an economy’s health and businesses’ profitability. By analyzing trends in total corporate profits, profit margins, and sectoral data, investors can gain valuable insights to inform their investment strategies.
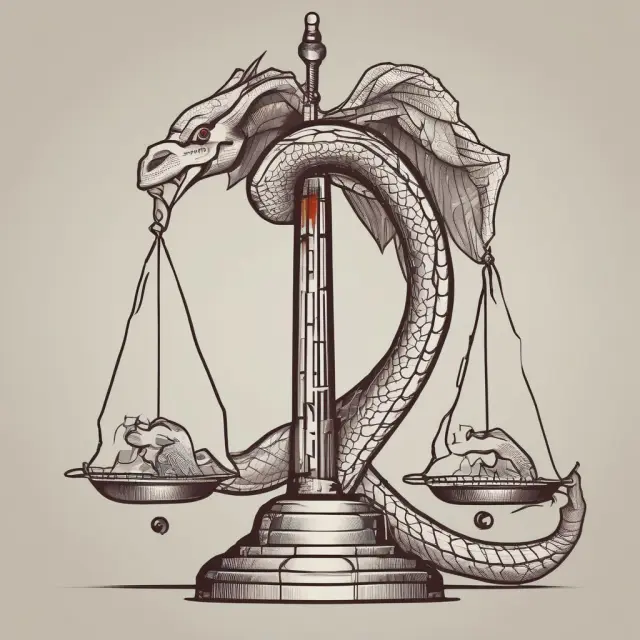
Labor Costs as a Lagging Indicator
Lagging indicators confirm trends and changes in economic conditions, offering valuable insights for businesses, investors, and policymakers. One important example of a lagging indicator is labor costs. Labor cost per unit of output represents the total payroll expenses incurred by firms to produce a single unit of their product or service. As an economic indicator, labor cost per unit of output can offer valuable insights into the relationship between wages, inflation, and overall economic growth.
Labor costs are typically calculated by dividing total labor costs, which include salaries, wages, and employee benefits, by total output or revenue produced over a specific time period, such as a month or a year. This measure can provide insight into the cost structure of companies within an industry and across industries.
Unlike leading indicators like consumer confidence surveys or manufacturing orders, labor costs are historical data points that lag behind changes in economic conditions. For instance, if inflation rises due to increased demand for goods and services, wage increases may follow as firms compete for labor in a tightening labor market. Consequently, labor costs would subsequently increase, reflecting the inflationary pressures experienced earlier.
The relationship between labor cost per unit of output and economic conditions is significant because it impacts both businesses and investors. For businesses, higher labor costs can influence production costs and ultimately affect their competitiveness in the marketplace. Companies may consider passing on increased labor costs through price increases or seeking ways to increase productivity to offset these expenses. Conversely, lower labor costs can result in increased profits for firms, potentially leading to higher stock prices.
For investors, understanding labor cost trends is crucial for making informed investment decisions. For example, if a company consistently experiences rising labor costs while its competitors maintain stable labor costs, it may be an indication that the former firm faces structural issues or operational inefficiencies that could negatively impact future profits. By considering labor cost data alongside other economic indicators, investors can make more accurate assessments of companies and industries.
In summary, labor costs serve as a valuable lagging indicator for understanding the relationship between wages, inflation, and overall economic conditions. By analyzing trends in labor costs over time, businesses and investors can better anticipate how changes in the economy might impact their operations and profitability.
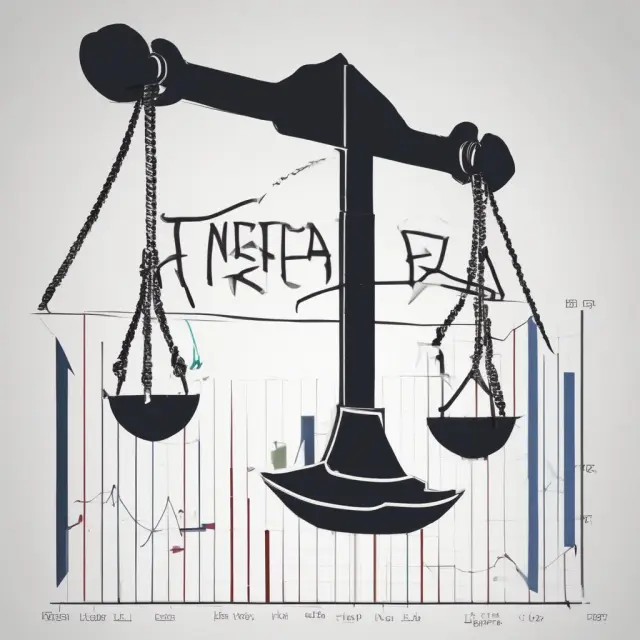
Interest Rates as a Lagging Indicator
Interest rates serve as an essential indicator of the economy’s health and play a significant role in investment strategies. They are closely tied to economic conditions and provide valuable information about the overall financial climate. However, interest rates function more effectively as lagging indicators than leading ones.
By definition, lagging indicators follow rather than lead the trends they represent. In this case, interest rates serve as an indicator of past and current economic conditions, rather than a predictor of future changes. They are influenced by economic shifts and respond to them accordingly, confirming already established trends.
The Federal Reserve, or “Fed,” is primarily responsible for setting the interest rate in the United States through its monetary policy actions. The Fed adjusts short-term interest rates based on its assessment of economic conditions, including inflation and employment levels. Since the economy experiences shifts before these changes are fully reflected in the Fed’s decision-making process, interest rates act as a lagging indicator.
Interest rate changes can take several weeks to months to have their full impact on the economy and financial markets, making them an ideal tool for confirming long-term trends. By observing how interest rates react to economic conditions and trends, investors and economists can better understand the direction of the overall economic climate. For instance, rising interest rates may signal that inflation is increasing or that the economy is strengthening, while falling rates could indicate a weakening economy or declining inflation pressures.
Investors often use interest rate information to inform their investment strategies. When considering buying or selling assets, they look to interest rate trends and changes as an essential factor in their decision-making process. For example, some investors may choose to buy stocks in sectors that benefit from rising interest rates (such as financials or utilities), while others might sell assets that could be negatively affected by them (like technology companies).
Interest rates also serve as a useful tool for businesses looking to evaluate their performance and make strategic decisions. By examining trends in interest rates, businesses can gain insight into the overall economic climate and assess how it may impact their operations, cash flows, and future growth prospects. For instance, if a company anticipates rising interest rates, it might adjust its pricing strategy or look for ways to reduce borrowing costs.
In conclusion, interest rates serve as valuable lagging indicators in finance and investment. They provide valuable insights into past and current economic conditions and trends, helping investors, economists, and businesses make informed decisions. By understanding the role of interest rates as a lagging indicator and staying attuned to their trends, individuals can position themselves effectively within the broader economic landscape.

Using Lagging Indicators for Business Performance Analysis
Lagging indicators can also play an essential role in evaluating business performance and informing future decision-making strategies. While leading indicators measure the potential future direction of various economic variables, lagging indicators reflect past performance. Understanding these metrics is crucial to businesses looking to gauge their progress toward strategic objectives, identify areas for improvement, or assess the impact of operational changes.
Businesses often use lagging indicators in conjunction with leading indicators to create a more comprehensive view of their performance and the overall economic landscape. Lagging indicators provide essential insights into outcomes such as sales growth, customer satisfaction, revenue retention, and profitability. These metrics allow businesses to measure their actual progress toward strategic goals and identify areas for improvement.
A few common examples of lagging business indicators include:
1. Sales Revenue: Sales revenue is a vital leading indicator when considering overall business performance. However, it’s also essential to analyze sales revenue trends in the past as a lagging indicator to assess long-term growth patterns and identify any underlying issues that may impact future sales projections.
2. Customer satisfaction: Measuring customer satisfaction is crucial for understanding a company’s ability to retain customers and build brand loyalty. While tracking current levels of customer satisfaction can be essential, analyzing trends in the past provides valuable context for businesses seeking to improve their offerings and overall performance.
3. Employee Turnover Rate: The employee turnover rate can indicate potential issues within an organization, such as poor working conditions or weak management. Analyzing historical turnover data can help identify patterns or trends that may require attention and inform recruitment strategies.
4. Net Profit Margin: Net profit margin is a critical indicator of financial performance for businesses. While it’s essential to monitor current levels, understanding historical net profit margins helps businesses evaluate their overall trend in profitability and assess the effectiveness of cost control measures.
5. Return on Investment (ROI): ROI is an important financial metric used by investors and businesses alike to measure the performance of investments. Analyzing historical ROI data can help identify trends, inform future investment decisions, and provide context for understanding the impact of strategic changes.
By combining these lagging indicators with leading indicators, businesses gain a more holistic view of their performance and the broader economic climate. This information helps them make data-driven decisions, identify areas for improvement, and align their strategies with long-term objectives.
In conclusion, understanding the role of lagging indicators in business performance analysis is crucial for making informed strategic decisions. By measuring past performance, businesses can evaluate their progress toward strategic goals, assess their impact on the overall economic landscape, and inform future investment strategies.

Technical Lagging Indicators: Confirming Trends in Financial Markets
A technical indicator is an analytical tool that helps investors and traders make informed decisions regarding buying or selling financial assets based on market trends. Among these indicators, some are considered lagging, as they follow the trend of asset prices instead of leading them. In this section, we’ll discuss various lagging technical indicators, their role in investment strategies, and potential limitations.
Lagging technical indicators confirm price trends, providing investors with a reliable sign that a particular trend is established. These indicators are particularly helpful when the market experiences strong volatility, as they help traders filter out false signals from genuine trends. One prominent example of a lagging technical indicator is the moving average (MA). The MA is calculated by taking the average price of an asset over a specified period. As new data points accumulate, the MA shifts to reflect the updated trend in the market.
Another commonly used lagging indicator is Bollinger Bands. This indicator consists of three lines: a moving average (MA) and two standard deviation lines. These bands expand when volatility rises and contract when it falls. A price breakout from the upper or lower band can indicate a significant trend reversal or continuation, depending on which side is breached.
These technical indicators are crucial for traders as they help confirm trends and reduce false signals. However, their reliance on historical data might make them less effective in capturing abrupt price movements. For instance, during periods of extreme volatility, these indicators may lag significantly behind the market trend, causing potential missed opportunities or incorrect trade executions.
Lagging indicators can be useful when employed alongside leading indicators to create a comprehensive investment strategy. By combining both types of indicators, traders and investors can benefit from early warnings on potential price shifts while also receiving confirmation that the trend has materialized. Incorporating lagging indicators into your trading or investment strategy offers a well-rounded approach, ensuring that you are responsive to both short-term volatility and long-term trends.
In conclusion, understanding technical lagging indicators is crucial for any investor or trader looking to stay informed about market trends and asset price movements. By familiarizing yourself with these indicators, you can enhance your investment strategy and make more informed decisions, ultimately increasing the probability of achieving long-term success in the financial markets.

FAQ: Lagging Indicators in Finance and Investment
Question 1: What exactly is a lagging indicator?
Answer: A lagging indicator is an observable or measurable factor that changes after the economic, financial, or business variable with which it is correlated has changed. These indicators confirm trends rather than predict them, making them valuable for understanding long-term shifts in the economy, businesses, and investment markets.
Question 2: What are some common examples of lagging indicators?
Answer: Some common economic lagging indicators include the unemployment rate, corporate profits, and labor cost per unit of output. In finance, interest rates can act as effective lagging indicators since they change in response to severe market movements. Economic measurements like gross domestic product (GDP), consumer price index (CPI), and balance of trade (BOT) are also considered lagging indicators due to their retrospective nature compared to leading economic indicators.
Question 3: How do businesses use lagging indicators?
Answer: Businesses utilize lagging indicators as part of their key performance indicators (KPIs), allowing them to evaluate past performance and outcomes. These metrics, such as sales revenue or customer satisfaction, provide insight into a business’s overall performance and help inform future strategies based on historical data.
Question 4: What is the difference between lagging and leading indicators?
Answer: Leading indicators are observable factors that change before the economic, financial, or business variable with which they are correlated changes, while lagging indicators confirm trends after the fact. The former helps forecast future trends, while lagging indicators provide valuable context to understand past and current conditions.
Question 5: What is a technical lagging indicator?
Answer: A technical lagging indicator is a tool used in finance and trading that confirms price movements of an underlying asset after the shift has occurred. For instance, moving averages or momentum indicators can be considered technical lagging indicators since they follow price trends instead of leading them. This information allows traders to validate trends and potentially enter positions at more opportune times.
Question 6: Why are lagging indicators important?
Answer: Lagging indicators provide valuable insight into the economy, businesses, and financial markets by confirming long-term trends and shifts that have already taken place. They help investors and analysts better understand past performance and economic conditions, enabling them to make informed decisions based on historical data. Additionally, they offer a counterpoint to leading indicators, providing a more complete picture of the overall situation.
 Next entry · No. 2,754Understanding Laissez-Faire Economics: Beliefs, History, Criticism, and Implications for Investors
See also
-
 No. 3,176
07 Mar 2025
20 min
A Comprehensive Guide to Understanding and Utilizing Effective Business Metrics
Business Finance
No. 3,176
07 Mar 2025
20 min
A Comprehensive Guide to Understanding and Utilizing Effective Business Metrics
Business Finance -
 No. 5,712
01 Oct 2025
17 min
Understanding Wholesale Trade: A Key Economic Indicator for Institutional Investors
Business Finance
No. 5,712
01 Oct 2025
17 min
Understanding Wholesale Trade: A Key Economic Indicator for Institutional Investors
Business Finance -
 No. 3,459
30 Mar 2025
17 min
Understanding New Home Sales: A Key Economic Indicator for Professional Investors
Business Finance
No. 3,459
30 Mar 2025
17 min
Understanding New Home Sales: A Key Economic Indicator for Professional Investors
Business Finance -
 No. 2,603
20 Jan 2025
19 min
Understanding Jobless Claims: An Important Indicator for Investors
Business Finance
No. 2,603
20 Jan 2025
19 min
Understanding Jobless Claims: An Important Indicator for Investors
Business Finance -
 No. 2,233
20 Dec 2024
18 min
Understanding Housing Starts: A Key Economic Indicator in Finance and Investment
Business Finance
No. 2,233
20 Dec 2024
18 min
Understanding Housing Starts: A Key Economic Indicator in Finance and Investment
Business Finance -
 No. 1,978
29 Nov 2024
19 min
Understanding Guaranteed Bonds: Risks, Advantages, and How They Work
Business Finance
No. 1,978
29 Nov 2024
19 min
Understanding Guaranteed Bonds: Risks, Advantages, and How They Work
Business Finance