Understanding Oscillators: Technical Analysis Tools for Overbought and Oversold Conditions
Understand the power of oscillators in technical analysis for identifying overbought and oversold conditions. Explore popular oscillators such as…
Introduction to Oscillators: Technical Analysis Indicators
Oscillators are essential technical analysis tools used by traders to identify overbought or oversold conditions within security prices. These indicators work by constructing high and low bands around extreme values, then generating a trend indicator that fluctuates between those bounds (Levine, 2021). When the oscillator’s value approaches these upper or lower extremes, traders interpret it as an overbought or oversold condition, respectively. This section will explain what oscillators are, their significance in technical analysis, and how they are used to uncover momentum shifts.
The essence of oscillators lies in their ability to provide valuable information for traders when the market exhibits a lack of clear trends, such as sideways trading (Levine, 2021). By detecting shifts in momentum and highlighting potential buying or selling opportunities, oscillators enable investors to make more informed decisions about asset entry and exit points. Some common oscillators include the stochastic oscillator, relative strength index (RSI), rate of change (ROC), and money flow index (MFI).
Investors use various methods to calculate oscillators, including applying different moving averages and smoothing techniques (Levine, 2021). Oscillators are typically displayed on a percentage scale ranging from 0 to 100, representing the closing price in relation to the total price range for a specified number of bars. When an oscillator moves above 70 to 80% of its total price range, traders consider the asset overbought and may opt for selling opportunities (Levine, 2021). Conversely, if the oscillator falls below 30 to 20%, it signals an oversold condition, indicating potential buying opportunities.
However, it’s important to note that oscillators can be unreliable during price breakouts, where a security breaks out of its established range and displays new trends (Levine, 2021). In such instances, oscillator signals may mislead traders, necessitating additional caution and analysis.
To optimize the effectiveness of oscillators, traders often combine them with other technical indicators or chart reading skills (Levine, 2021). For instance, a moving average crossover indicator can be used to determine whether a market is trending or range-bound. Once an investor ascertains that the market is not in a trend, oscillator signals become more valuable and trustworthy.
Overall, oscillators are versatile technical analysis tools that enable traders to discover momentum shifts and capitalize on overbought or oversold conditions within securities. By understanding the mechanics of oscillators and their significance in technical analysis, investors can make well-informed trading decisions and enhance their overall investment strategies.

Mechanics of an Oscillator
Oscillators play a pivotal role as technical analysis tools, revealing overbought or oversold conditions by constructing high and low bands around extreme values and generating a trend indicator that oscillates within these bounds. In the context of financial markets, traders interpret oscillator signals to determine asset price momentum. An oscillator is typically employed when it is challenging to discern an evident trend in a security’s stock price, particularly during sideways trading or horizontal movements.
Oscillators function based on two primary values: upper and lower extremes. Analysts calculate oscillators using various techniques that involve smoothing multiple moving averages and measuring the closing prices relative to the specified total price range for a defined period in a bar chart. The most common oscillators include the stochastic oscillator, RSI (Relative Strength Index), ROC (Rate of Change), and MFI (Money Flow Index).
These technical indicators are particularly valuable when used with other tools such as chart reading skills and trend identification indicators like moving averages. When an oscillator approaches the upper extreme value, it indicates an overbought condition, suggesting a sell opportunity. Conversely, an oversold signal arises when the oscillator approaches the lower extreme, pointing to a buy opportunity.
To calculate oscillator values, traders apply percentages to a scale from 0 to 100 based on the closing price’s relationship to the total price range for a particular number of bars in a bar chart. The upper and lower bands are typically set at 70 to 80% and 30 to 20%, respectively, indicating overbought or oversold conditions.
For instance, when an oscillator moves towards the upper band, it suggests that the asset is overbought, signaling a potential sell opportunity. Conversely, oscillators approaching the lower band indicate that the asset is oversold, suggesting a buy opportunity. The signals remain valid as long as the underlying security price remains within the established range.
However, oscillator signals may become misleading during price breakouts, which can result in extended periods of false overbought or oversold conditions. Technical analysts view oscillators as more effective when used in conjunction with a trend identification indicator, like moving averages. By determining if the market is trending or range-bound using moving averages, oscillator signals provide valuable insights into the short-term momentum of the security’s price action. Overall, oscillators are essential tools for traders and investors seeking to understand technical analysis better, providing insight into a security’s price momentum and trends while revealing opportunities for profitable trades based on overbought or oversold conditions.
Types of Oscillators: Stochastic, RSI, ROC, and MFI
Oscillators are essential technical analysis tools used by traders to gain insights into the short-term overbought or oversold conditions in an asset’s price action. These indicators oscillate between two extreme values, creating a trend indicator that traders use to identify potential buying or selling opportunities. In this section, we explore four popular types of oscillators: Stochastic oscillator, Relative Strength Index (RSI), Rate of Change (ROC), and Money Flow Index (MFI).
**Stochastic Oscillator**
The stochastic oscillator is a momentum indicator that calculates the ratio between the closing price and the range of the prices over a specified time period. It uses two lines: %K and %D, which are smoothed moving averages of the %K line. When the %K line crosses above the %D line, it signals potential buy opportunities. Conversely, when the %K line drops below the %D line, it indicates a sell signal.
**Relative Strength Index (RSI)**
The RSI measures the magnitude of recent price changes by comparing the size of gains to the size of losses over a specified period. It ranges from 0 to 100, with readings above 70 signaling overbought conditions and below 30 indicating oversold conditions. The RSI is often used as a trend-following momentum indicator or in conjunction with other indicators for trade confirmation.
**Rate of Change (ROC)**
The ROC is a simple momentum indicator that compares the rate of change between current and previous periods. The higher the percentage, the stronger the uptrend; conversely, the lower the percentage, the weaker the downtrend. When the ROC line crosses back above or below zero, it indicates potential trend reversals.
**Money Flow Index (MFI)**
The MFI is a volatility-based momentum indicator that calculates buying and selling pressure by measuring money flow in and out of an asset. The MFI ranges from 0 to 100, with readings above 75 representing bullish conditions and below 25 indicating bearish conditions. Similar to other oscillators, the MFI can be used as a standalone indicator or alongside other indicators for confirmation.
While each oscillator has its unique characteristics, all these tools are designed to help traders identify potential buying and selling opportunities by providing insights into market momentum. To make informed decisions based on the information provided by oscillators, it is important to understand their signals and limitations. In the next section, we’ll dive deeper into interpreting oscillator signals in a sideways market and how they can be used effectively with moving averages.
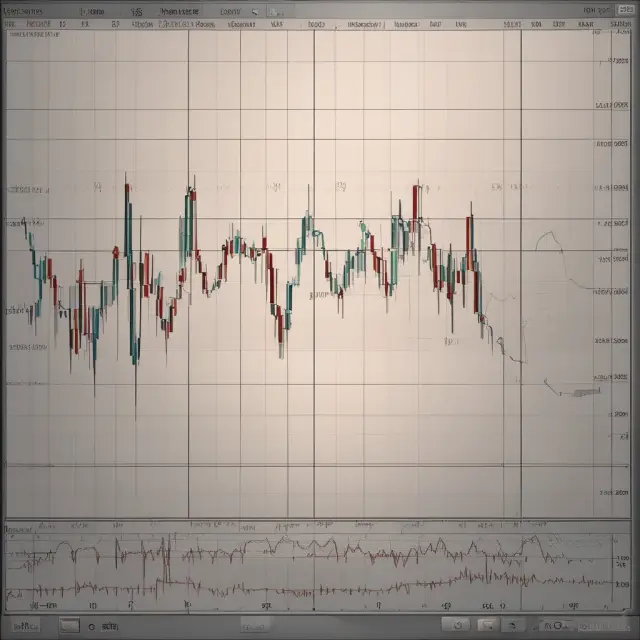
Overbought and Oversold Conditions: Understanding the Signals
Oscillators are technical analysis tools designed to provide short-term indications of overbought or oversold conditions in an asset’s price action. These conditions, often referred to as market extremes, can signal potential opportunities for traders looking to enter or exit positions based on the prevailing trend. In this section, we will delve deeper into understanding overbought and oversold conditions as they relate to oscillators.
What Are Overbought and Oversold Conditions?
In the context of oscillators, overbought conditions occur when an asset’s price is considered to have risen too high, relative to its historical average, while oversold conditions indicate that an asset’s price has fallen significantly below its average. Traders often use these terms interchangeably with ‘extended’ or ‘overextended,’ meaning a stock is beyond normal price levels. These conditions are important because they can help provide insight into the potential strength or weakness of a trend, and may serve as signals for entering or exiting positions.
Significance and Interpretation of Overbought and Oversold Conditions
The significance of overbought and oversold conditions lies in their potential to indicate potential buying or selling opportunities. When an asset is overbought, it may be considered ripe for a pullback, potentially presenting an opportunity for those looking to sell. Conversely, an oversold condition may represent a potential entry point for buyers, as the price has been beaten down and could be poised for a recovery. These conditions do not necessarily imply that the trend will reverse at these points; they merely suggest that the current trend may be approaching an inflection point.
Interpreting Overbought and Oversold Signals in Oscillators
Oscillator signals are determined based on the oscillator’s value relative to its historical extremes, represented by upper and lower bands. When an oscillator reaches these bands, it may indicate that the underlying asset is overbought or oversold, respectively. It is important to note that oscillator signals should not be considered in isolation but should be used in conjunction with other technical analysis tools and price action analysis for confirmation of potential trade opportunities.
Understanding Overbought and Oversold Conditions: An Example
Consider a stock chart displaying an oscillator like the RSI (Relative Strength Index) alongside the asset’s price bars. As the price rises, the RSI oscillates above its neutral value of 50, indicating that the underlying asset is in an uptrend. When the RSI reaches overbought territory, typically above 70, it may suggest a potential selling opportunity for traders. Likewise, when the stock’s price declines and the RSI falls below the oversold threshold, usually below 30, it could be seen as a buying opportunity.
Keep in mind that oscillators are not infallible indicators of market extremes, and their signals should be used with caution and confirmation from other technical analysis tools and price action analysis before making any trading decisions. In the next section, we’ll explore how oscillators can be combined with moving averages for improved trend identification.
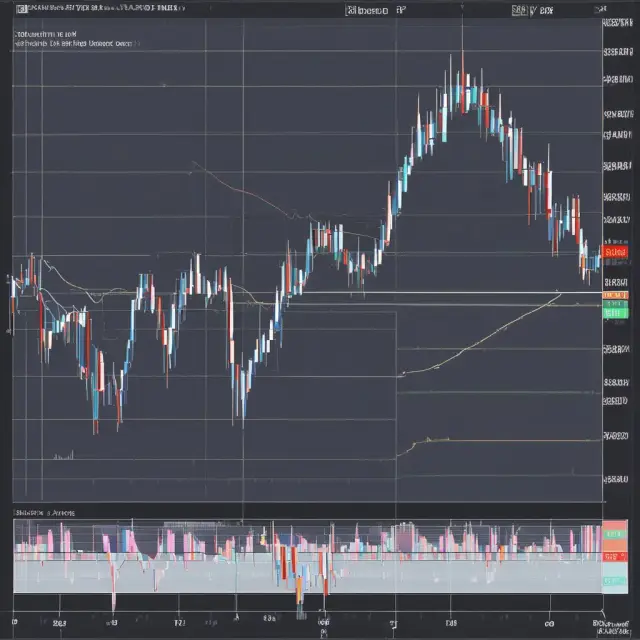
Interpreting Oscillator Signals in a Sideways Market
An oscillator is a versatile technical analysis tool that plays a crucial role when the market exhibits sideways price movements. In these situations, oscillators can provide valuable insights by indicating overbought or oversold conditions. By understanding how to interpret oscillator signals correctly, traders can capitalize on opportunities and make informed decisions.
In sideways markets, an asset’s price remains within a specific range, making it challenging for investors to determine the direction of the trend. Oscillators come in handy during such market conditions as they oscillate between two extreme values, offering clear signals when the asset is overbought or oversold.
The most popular oscillators used in technical analysis are Stochastic, RSI (Relative Strength Index), ROC (Rate of Change), and MFI (Moving Average Convergence Divergence). Each oscillator has its unique characteristics and strengths, making it essential to choose the one that best suits your trading style.
To understand how oscillators work in a sideways market, let’s delve deeper into their mechanics. Oscillators are typically displayed as a percentage scale between 0 and 100. They measure the asset’s closing price against its total price range for a specific number of bars within a bar chart. The trend indicator is created by smoothing out and manipulating multiple moving averages, allowing traders to gauge current market conditions and identify potential opportunities.
In sideways markets, an oscillator moves around a neutral value, which is usually 50 for Stochastic, RSI, and MFI, while ROC does not have a neutral value as its calculations are based on gains or losses. The overbought condition is signaled when the oscillator reaches an upper threshold of 70 to 80%, indicating a sell opportunity. Conversely, an oversold condition occurs when the oscillator falls below a lower threshold of 30 to 20%, presenting a buy opportunity. These signals remain valid as long as the price of the underlying security remains within its established range.
It is essential to remember that oscillators may provide misleading signals during price breakouts, which can be either the beginning of a new trend or the resetting of the sideways market’s current bounds. During these situations, traders must exercise caution and combine oscillator analysis with other technical tools and indicators to gain accurate insights into the market’s direction.
For instance, a moving average crossover indicator can help determine if the market is in a trend or range-bound, allowing investors to make informed decisions based on oscillator signals. By combining oscillators with multiple time frames and other technical tools, traders can refine their analysis and improve their overall trading performance.
In conclusion, oscillators are indispensable tools for traders navigating sideways markets. By understanding how these indicators work and interpreting their signals correctly, investors can maximize their opportunities and make informed decisions in various market conditions.
Combining Oscillators with Moving Averages
For effective stock analysis, oscillators are often combined with moving averages to identify potential buy and sell opportunities. When oscillators are used alone, they may provide conflicting signals or false alarms due to their sensitivity to short-term price movements. However, the combination of these two powerful technical indicators can significantly enhance the accuracy of the analysis and filter out unwanted noise.
In a sideways market, where the stock price tends to stay within a specific range without any clear trend, oscillators are particularly useful. They help traders identify overbought or oversold conditions and generate buy or sell signals accordingly. However, moving averages provide valuable insights into the underlying trend direction and momentum, which can further confirm the validity of the oscillator’s signals.
Let us dive deeper into understanding how oscillators and moving averages complement each other in stock analysis:
1. Enhanced Signal Accuracy: Oscillators generate buy or sell signals when the value approaches overbought (above 70%) or oversold (below 30%) levels, respectively. However, these signals might not always be accurate, especially in a sideways market with frequent price fluctuations. By combining oscillators with moving averages, traders can filter out false signals and improve the overall accuracy of their analysis.
For instance, if an oscillator indicates an oversold condition while the stock’s price is above its 50-day moving average, it might be a potential buy signal because the moving average confirms that the overall trend is still upwards. Conversely, if an oscillator suggests an overbought condition when the price is below its moving average, it could indicate a selling opportunity as the trend is likely to reverse.
2. Confirming Trend Direction: Moving averages help confirm the validity of the trend direction and provide buy or sell signals based on the crossover between different time frames or moving averages. This information can be used to identify potential entry and exit points for trades, as well as confirming the underlying trend direction.
For example, if a short-term oscillator generates an oversold signal while the stock’s price is below its long-term moving average, it might suggest that the overall trend is bearish, and traders should consider selling the stock or shorting it to take advantage of the downtrend.
3. Smoothing Out Short-Term Fluctuations: Oscillators are sensitive to short-term price fluctuations, which may result in whipsaws or false signals. By combining oscillators with moving averages, traders can smooth out these short-term fluctuations and focus on longer-term trends.
For example, if an oscillator generates a buy signal (oversold condition) when the stock’s price is fluctuating within a specific range but its moving average shows no clear trend direction, traders might consider waiting for additional confirmation from other indicators or analyzing the underlying fundamental factors before making a trade decision.
In conclusion, oscillators and moving averages are powerful technical indicators that can provide valuable insights into stock price trends and momentum when used together. By combining these tools, traders can enhance the accuracy of their analysis, filter out false signals, confirm trend directions, and smooth out short-term fluctuations for more effective and profitable trading strategies.

Limitations and Misconceptions: Price Breakouts and False Signals
Understanding the limitations and misconceptions surrounding oscillators’ performance during price breakouts is crucial for traders seeking success in their investments. Oscillators, as popular technical analysis tools, are often used to identify overbought and oversold conditions in markets where no clear trend is apparent. While these indicators can be valuable assets in range-bound markets, they may not provide reliable signals during price breakouts, leading to false signals or missed opportunities.
Price Breakout: Definition and Significance
Price breakouts occur when the price of a security trades above resistance levels (for uptrends) or below support levels (for downtrends). When this happens, the oscillator’s readings may remain in the overbought or oversold ranges for an extended time. This misalignment between the oscillator and the actual market conditions can lead to confusion among traders, making it essential to understand these limitations to mitigate potential losses or missed opportunities.
False Signals: Overbought and Oversold During Price Breakouts
During price breakouts, oscillators may give false signals due to their inherent design, which is based on the assumption that prices will trade within a certain range. When a security breaks out of this range, the oscillator might continue showing overbought or oversold conditions even when they no longer apply to the market. For instance, if an uptrend occurs after a prolonged period of sideways trading, the oscillator may display an oversold reading during the initial stages of the trend, which could lead investors to miss the opportunity.
Mitigating Limitations: Combining Oscillators with Other Indicators
One effective method for overcoming the limitations and misconceptions surrounding oscillators’ performance during price breakouts is to combine them with other technical indicators, like moving averages or trend lines. By using multiple indicators in conjunction, traders can develop a more comprehensive understanding of market conditions and identify reliable buy and sell signals that stand up to price volatility and breakouts.
In conclusion, oscillators are essential tools for investors seeking to make informed decisions in range-bound markets but may not be as effective during price breakouts. Understanding the limitations and misconceptions surrounding false signals and price breakouts can help traders avoid potential losses or missed opportunities while maximizing their investment gains. By combining oscillators with other technical indicators, traders gain a more complete perspective on market trends and conditions, making it easier to identify reliable buy and sell signals that stand up to the test of time.
Choosing the Right Oscillator for Your Trading Style
Oscillators are among the most valuable technical analysis tools used to evaluate financial securities by measuring their momentum and identifying overbought or oversold conditions. These momentum indicators can be especially beneficial when analyzing a stock that exhibits sideways trading or is difficult to decipher using chart reading skills alone. However, not all oscillators are created equal, making it crucial to understand your preferred trading style and choose the oscillator best suited for you.
In technical analysis, investors can find five primary types of oscillators: Stochastic Oscillator, Relative Strength Index (RSI), Rate of Change (ROC), and Money Flow Indicator (MFI). Each oscillator has its strengths and weaknesses, with the choice between them depending on your trading style, risk tolerance, and time frame. Let’s discuss each oscillator’s unique characteristics to help you determine which one aligns best with your approach to trading.
Stochastic Oscillator (STO)
The Stochastic Oscillator is a momentum indicator that compares the closing price of an asset to its price range over a predetermined period. This oscillator typically ranges between 0 and 100, with values above 80 representing an overbought condition, while values below 20 indicate oversold conditions. The Stochastic Oscillator is particularly effective for short-term traders looking to identify potential trend reversals, as it can generate signals even when the asset’s price is barely moving.
Relative Strength Index (RSI)
The RSI is another popular oscillator used by traders to measure an asset’s overbought or oversold conditions based on its recent price movements and trend direction. It ranges between 0 and 100, with values above 70 representing overbought conditions and values below 30 indicating oversold conditions. The RSI can be a more suitable choice for intraday traders who focus on short timeframes, as it offers more sensitive signals compared to the Stochastic Oscillator.
Rate of Change (ROC)
The Rate of Change oscillator calculates the percentage change between two consecutive price points in a security’s price history. This momentum indicator is not limited to specific ranges and can be applied to various timeframes, making it versatile for traders with different preferences. The ROC generates overbought signals when its value turns negative, indicating that the asset’s price has fallen by a certain percentage compared to its previous period. Conversely, oversold conditions are indicated when the ROC values turn positive, showing that the asset’s price has risen significantly from its previous period.
Money Flow Indicator (MFI)
The Money Flow Index is an oscillator that assesses the buying and selling pressure in a security by calculating the money flow volume (MFV). The MFI ranges between 0 and 100, with values above 70 representing overbought conditions and values below 30 indicating oversold conditions. This oscillator can be an excellent choice for traders focusing on longer timeframes or those who want to gain insights into market sentiment by considering the buying and selling pressures.
Ultimately, choosing the right oscillator comes down to understanding your trading style, risk tolerance, and preferred timeframe. For instance, short-term traders may opt for the Stochastic Oscillator to capitalize on trend reversals or the RSI for more sensitive signals. Longer-term investors might prefer using the Money Flow Indicator to gauge market sentiment and identify strong buying/selling pressures in their investments.
Regardless of which oscillator you choose, remember that no single indicator can provide infallible trading decisions. It is crucial to incorporate multiple indicators, chart reading skills, and other technical tools when making investment decisions to optimize your risk management strategy and maximize potential profits.

Advanced Techniques: Multiple Time Frames, Filtering, and Settings
Oscillators, being one of the most crucial technical indicators in trading, can be further enhanced with advanced techniques to improve their accuracy and applicability. In this section, we delve into using multiple time frames, filtering signals, and customizing settings for a more refined analysis.
Using Multiple Time Frames
While oscillators are generally considered effective for sideways markets, incorporating multiple time frames can strengthen the significance of their indications. For instance, an investor can examine the 14-day RSI on both the daily and hourly charts to understand short term and long term trends. By observing how the signals correlate between different time frames, traders can make informed decisions regarding entry and exit points.
Filtering Signals
False signals, which occur due to market noise, can distort oscillator readings, leading to losses. One approach to mitigate this issue is filtering the signals by applying a moving average (MA) or a Bollinger Band (BB) to the indicator itself. By setting up these filters, traders can enhance the signal’s reliability and reduce noise. For instance, an investor may choose to only consider oscillator signals when they coincide with the MA crossover or BB breakout.
Customizing Settings
Oscillators have various parameters that traders can modify according to their trading style and market conditions. By changing these settings, users can create unique indicators tailored to specific strategies. For instance, an investor may prefer a shorter period for the RSI when day-trading compared to a longer one in swing trading. Moreover, different securities might call for various oscillator configurations. Customizing oscillators not only increases their versatility but also enhances traders’ ability to adapt to distinct market conditions.
Conclusion:
In conclusion, oscillators provide valuable information on overbought and oversold conditions, allowing traders to make informed decisions when the price action is unclear. By combining oscillators with advanced techniques such as multiple time frames, filtering signals, and customizing settings, investors can significantly improve their accuracy, adaptability, and overall performance. By following these practices, traders can maximize the benefits of using oscillators in technical analysis and effectively navigate the financial markets.
FAQs: Frequently Asked Questions about Oscillators
Oscillators are powerful tools within technical analysis that help traders identify short-term overbought or oversold conditions in a security’s price action. These indicators oscillate around various high and low bands, providing valuable information to investors for making informed trading decisions. In this section, we address some of the most common questions about oscillators.
1) What is the purpose of an oscillator? An oscillator is a technical analysis indicator used to find short-term overbought or oversold conditions in a security’s price action. It does this by constructing high and low bands and measuring a trend indicator that fluctuates within those bounds. Oscillators are essential for traders when identifying trends or ranges, as they help confirm buy and sell signals generated by other technical analysis tools.
2) How do oscillators work? In technical analysis, oscillators are often used in conjunction with other indicators to make trading decisions. They are most effective when a clear trend is not evident in the price action of an asset. Oscillators typically measure the momentum of an asset by calculating the relationship between its closing price and its total price range over a specified number of bars, usually expressed as a percentage from 0 to 100. A common technique for manipulating oscillators is the use of multiple moving averages. When the market trades in a specific range, an oscillator follows the price fluctuations and indicates an overbought condition when it exceeds 70-80% of the specified total price range, signaling a sell opportunity. Conversely, when the oscillator falls below 30-20%, the investors consider the asset to be oversold, which is a buy signal. These signals remain valid as long as the price remains within the established range. However, during a price breakout, the signals can become misleading.
3) What are some common oscillators? The four most widely used oscillators in technical analysis include the Stochastic Oscillator, Relative Strength Index (RSI), Rate of Change (ROC), and Money Flow Index (MFI). Each oscillator has its unique strengths, differences, and applications.
4) What is a price breakout? A price breakout occurs when the price of an asset moves beyond the high or low range established by technical indicators like oscillators. During this event, the signals generated by oscillators may remain in the overbought or oversold ranges for an extended period of time and become misleading. Technical analysts recommend combining oscillators with trend-identifying indicators, such as moving average crossovers, to confirm price breakout signals.
5) How do I choose the right oscillator for my trading style? Understanding your trading style is crucial when selecting an oscillator that suits your needs. Some oscillators are better suited for short-term traders, while others cater to long-term investors. For example, the Stochastic Oscillator is favored by short-term traders due to its sensitivity to recent price action and trend reversals. In contrast, the RSI is preferred by long-term investors as it provides a more stable signal when used with a longer time frame. By considering your trading style, risk tolerance, and investment goals, you can choose an oscillator that aligns best with your approach to the financial markets.
 Next entry · No. 3,806Understanding the Oslo Stock Exchange (OSL): History, Trading, and Companies
See also
-
 No. 4,752
14 Jul 2025
16 min
Understanding the Stochastic Oscillator: A Momentum Indicator for Overbought and Oversold Conditions
Financial Tools
No. 4,752
14 Jul 2025
16 min
Understanding the Stochastic Oscillator: A Momentum Indicator for Overbought and Oversold Conditions
Financial Tools -
 No. 4,531
26 Jun 2025
20 min
Understanding the Relative Strength Index (RSI): An Essential Momentum Indicator for Technical Analysis
Financial Tools
No. 4,531
26 Jun 2025
20 min
Understanding the Relative Strength Index (RSI): An Essential Momentum Indicator for Technical Analysis
Financial Tools -
 No. 4,915
27 Jul 2025
20 min
Technical Analysis 101: A Comprehensive Guide for Institutional Investors
Financial Education
No. 4,915
27 Jul 2025
20 min
Technical Analysis 101: A Comprehensive Guide for Institutional Investors
Financial Education -
 No. 4,565
29 Jun 2025
21 min
Scalping: A High-Risk Trading Strategy for Profiting from Minor Price Changes
Finance Policy
No. 4,565
29 Jun 2025
21 min
Scalping: A High-Risk Trading Strategy for Profiting from Minor Price Changes
Finance Policy -
 No. 4,372
13 Jun 2025
18 min
Understanding the Relative Vigor Index (RVI) – A Comprehensive Guide for Institutional Investors
Business Finance
No. 4,372
13 Jun 2025
18 min
Understanding the Relative Vigor Index (RVI) – A Comprehensive Guide for Institutional Investors
Business Finance -
 No. 4,065
19 May 2025
20 min
Price Rate of Change (ROC) Indicator: Understanding Momentum in Finance
Financial Education
No. 4,065
19 May 2025
20 min
Price Rate of Change (ROC) Indicator: Understanding Momentum in Finance
Financial Education