Understanding the Relative Vigor Index (RVI) – A Comprehensive Guide for Institutional Investors

Understand the Relative Vigor Index (RVI), a powerful technical analysis tool for institutional investors. Learn calculation, interpretation & use cases.
What is the Relative Vigor Index?
The Relative Vigor Index (RVI) is an essential technical momentum indicator that measures the strength of a trend by assessing the relationship between a security’s closing price and its trading range. By comparing the closing price to the open price, RVI provides valuable insights into market conditions and potential price shifts for institutional investors.
The RVI is particularly significant in the realm of technical analysis because it oscillates above or below a centerline instead of within a banded trend, like other popular indicators such as Moving Average Convergence Divergence (MACD) or Relative Strength Index (RSI). This unique characteristic makes the RVI an indispensable tool for monitoring trends and identifying potential shifts.
The RVI’s value lies in its ability to identify divergences between price and indicator movements, which can predict trend reversals. When a security’s price is rising but the RVI displays a falling trend, it suggests that a near-term price decline is imminent. Conversely, if the price is declining while the RVI is trending upward, the trend may be reversing to an uptrend.
To calculate the Relative Vigor Index (RVI), traders first choose a specific time frame, which could range from minutes, hours, days, weeks, or months. Once determined, open, high, low, and close values for the current bar and the lookback periods are identified. Subsequently, Simple Moving Averages (SMAs) for both the numerator and denominator are calculated over the chosen time frame. The RVI value is then derived by dividing the Numerator value from the Denominator value. Finally, the result is plotted on a chart with the signal line equation applied to help visualize trend changes.
Incorporating the Relative Vigor Index (RVI) into a trading strategy can prove advantageous for institutional investors seeking to understand market trends and predict potential shifts. Its ability to oscillate above or below a centerline provides unique insights when compared to other indicators. The RVI’s effectiveness is particularly noteworthy in trending markets, where it excels at generating reliable signals. However, like all technical indicators, the RVI is not without its limitations. It may produce false signals during range-bound markets and can be improved by using longer lookback periods to reduce the impact of short-term price fluctuations.
In the following sections, we’ll delve deeper into the calculation process, interpretations, advantages, limitations, and various applications of the Relative Vigor Index (RVI). Stay tuned for more insights on this powerful momentum indicator!

The Formula for Calculating the RVI
The Relative Vigor Index (RVI) is a powerful momentum indicator in technical analysis that reveals the strength of trends by comparing a security’s closing price to its trading range, all while smoothing the data through moving averages. Its significance lies in the observed tendency for prices to close higher than they open during uptrends and lower in downtrends. In this section, we will delve deeper into understanding how to calculate the RVI indicator.
The formula for calculating the RVI may initially appear complex, but it follows a straightforward logic:
NUMERATOR = Close – Open
+ (2 × (Close – Open [previous]))
+ (2 × (Close – Open [two periods before previous]))
+ (Close – Open [three periods before two periods before previous])
DENOMINATOR = High – Low
+ (2 × (High – Low [previous]))
+ (2 × (High – Low [two periods before previous]))
+ (High – Low [three periods before two periods before previous])
RVI = SMA(NUMERATOR, N) / SMA(DENOMINATOR, N)
Signal Line = RVI + 2 × SMA(SMA(NUMERATOR, N), N) + 2 × SMA(SMA(DENOMINATOR, N), N)
In the above formula:
- Open and Close represent the opening and closing prices for a given time frame.
- High and Low represent the highest and lowest price recorded in that same time frame.
- N represents the number of periods being examined.
- SMA stands for Simple Moving Average.
To calculate the RVI
- Choose an N period to analyze.
- Identify the open, high, low, and close values for the current bar as well as past lookback periods.
- Calculate the simple moving averages (SMAs) for both the numerator and denominator over the N-period time frame.
- Divide the sum of the NUMERATOR values by the sum of the DENOMINATOR values.
- Determine the signal line by calculating a new SMA for the RVI value, as well as a second SMA for the smoothed NUMERATOR and DENOMINATOR values over the same N period.
- Plot the RVI line above or below the price chart with the signal line to visualize the relationship between the two.
Understanding how to calculate the Relative Vigor Index opens the door for better insight into market trends and potential opportunities. In the next section, we will explore the significance of interpreting and utilizing this powerful momentum indicator.

How to Interpret and Use the RVI
The Relative Vigor Index (RVI) is a powerful momentum indicator that can assist institutional investors in identifying trends and potential trend reversals within their portfolios. The RVI measures the strength of a security’s closing price relative to its trading range, making it an essential tool for gauging market conditions and anticipating price movements.
To fully understand how to interpret and use the Relative Vigor Index effectively, consider the following key insights:
1. Interpreting RVI values: A higher RVI value indicates that a security’s closing price is higher than its opening price and therefore demonstrates strong upside momentum. Conversely, a lower RVI value suggests that a security’s closing price is below its opening price, pointing to weak downward momentum.
2. Understanding RVI lines: The RVI oscillates around a centerline, which represents the average for the RVI over the selected time period. A security’s RVI line crossing above this centerline indicates bullish sentiment and a trending market, while a crossing below the line signals bearish sentiment and a downtrending market.
3. Divergences: A divergence between the RVI indicator and the underlying price may indicate an imminent reversal in the current trend. For instance, if the security’s price continues to rise while the RVI starts to decline, this could signal a potential bearish turn. Conversely, if the RVI is rising while the price is declining, it might suggest a bullish shift is on the horizon.
4. Crossovers: Similar to other momentum indicators, the RVI uses a signal line to help investors determine when to enter or exit positions based on crossover events. A bullish crossover occurs when the RVI crosses above its signal line, indicating that a potential buying opportunity might be present. Conversely, a bearish crossover, where the RVI falls below its signal line, can serve as a sell signal.
5. Setting up the indicator: To begin using the RVI in your investment analysis, you’ll first need to select an appropriate time frame and input the necessary data points, including the security’s opening, closing, high, and low prices. You can calculate the RVI using the formula provided earlier or use a charting software that offers built-in RVI functions.
By staying informed about these fundamental aspects of the Relative Vigor Index, institutional investors can harness its power to make more insightful investment decisions and maximize their portfolio’s potential returns.

Advantages of Using the Relative Vigor Index (RVI)
The Relative Vigor Index (RVI), a momentum indicator used in technical analysis, holds significant merit for institutional investors as it offers valuable insights into the strength and potential direction of trends. Its unique approach to measuring momentum by comparing a security’s closing price to its trading range while smoothing the results using a simple moving average (SMA) sets the RVI apart from other indicators like stochastics oscillator or relative strength index (RSI). This section sheds light on the benefits of utilizing the RVI in an institutional context and highlights its effectiveness, particularly in trending markets.
First and foremost, the RVI is a powerful tool for identifying trend direction with precision. It allows investors to gauge the overall momentum of a security, which can be crucial information when making informed investment decisions. By comparing the closing price to the open and smoothing the results with moving averages, the RVI provides insight into the underlying strength of a trend. When the closing price consistently closes above the open, as is often the case during bullish trends, the RVI is expected to rise due to the close’s position at the top of the range, while the open remains near the low.
Moreover, the RVI offers valuable information about potential trend reversals through divergence signals. Divergences between the RVI indicator and the security’s price can suggest a near-term change in the direction of the trend. For example, if a stock price is rising but the RVI is falling, this indicates that the momentum may soon reverse and the stock could potentially experience a downturn. Conversely, if the price is declining while the RVI is rising, it suggests that the downtrend might be coming to an end.
Another advantage of using the RVI lies in its ability to adapt to varying market conditions. While it works best in trending markets, the RVI can also provide valuable insights in range-bound markets by signaling potential breakouts from trading ranges or identifying potential support and resistance levels. By considering the RVI’s signals alongside other forms of technical analysis, investors can increase their chances of making profitable trades.
Furthermore, the RVI’s versatility extends to various timeframes. Its applicability across different time horizons allows investors to gain a holistic view of the market and adjust strategies accordingly, whether it be for short-term or long-term investment objectives. By analyzing the RVI at different time intervals, institutional traders can make informed decisions based on both short-term price movements and larger, overarching trends.
In conclusion, the Relative Vigor Index (RVI) is a powerful momentum indicator for institutional investors that offers valuable insights into trend direction and potential trend reversals. Its unique approach to measuring momentum, adaptability across various market conditions, and applicability across different timeframes make it an essential tool for those seeking to gain a competitive edge in the financial markets.

Limitations of Using the RVI
Despite its valuable insights, the Relative Vigor Index (RVI) does have certain limitations that institutional investors should be aware of before incorporating it into their investment strategies. One major concern is the potential for false signals, particularly in range-bound markets where trends are not well defined. The RVI generates more reliable results when clear uptrends or downtrends exist as it effectively measures the strength of a trend by comparing closing prices to trading ranges. However, in volatile and choppy markets, this oscillator may produce misleading signals due to frequent price reversals and erratic price movements.
To address the limitations of RVI in range-bound markets, investors can apply a longer lookback period, which helps minimize the impact of short-term whipsaws and countertrends. A larger time frame allows for more stable trends and reduces the frequency of false signals, making the RVI a more reliable indicator for these market conditions. It’s essential to note that using a longer lookback period may result in delayed entry or exit points since it requires the confirmation of more data before triggering signals.
Another limitation of the Relative Vigor Index is its reliance on historical prices. As with other technical indicators, it only reflects past price movements and does not account for external factors like economic events, company fundamentals, or market sentiment. It’s crucial to combine this indicator with other analytical tools, such as fundamental analysis and market news, to gain a more comprehensive understanding of the underlying investment opportunities.
To summarize, the Relative Vigor Index (RVI) is an effective momentum indicator that provides valuable insights into price trends by measuring the strength of a trend through closing prices relative to trading ranges. Its main advantages include its ability to identify trend reversals and the fact it does not require any predefined parameters or input values. However, investors should be aware of its limitations, such as potential false signals in range-bound markets and the reliance on historical data only. To overcome these constraints, employing a longer lookback period and pairing RVI with other analytical tools can provide more accurate and reliable results for institutional investors.

Comparing the Relative Vigor Index to Other Technical Indicators
The Relative Vigor Index (RVI) is an essential momentum indicator for technical analysis, often compared with other popular indicators like Relative Strength Index (RSI) and Moving Average Convergence Divergence (MACD). Understanding the differences and similarities between these three indicators can help institutional investors make informed decisions in various market conditions.
Like RVI, both RSI and MACD are widely used to measure momentum and trend direction. However, their approaches and interpretations differ significantly.
RVI’s primary focus is on comparing a security’s closing price to its trading range while smoothing the results with moving averages. The RVI indicator oscillates around a center line rather than a banded trend like MACD. Divergences between the RVI and the price suggest near-term changes in trends.
On the other hand, the RSI measures the magnitude of recent price changes to assess overbought or oversold levels. It compares the average gain and loss for a specific time period. The RSI’s main strength lies in its ability to spot potential reversals by signaling when an asset is either overbought or oversold, which can be helpful in identifying entry and exit points.
MACD, on the other hand, is a trend-following momentum indicator that uses two moving averages: the Exponential Moving Average (EMA) and the Signal Line. It calculates the difference between these two moving averages to identify bullish or bearish trends, with buy signals given when the fast EMA crosses above the slow EMA, and sell signals indicated by a crossover in the opposite direction.
When comparing RVI to MACD and RSI, it’s important to understand their respective strengths and limitations.
RVI can be more effective than other momentum indicators in trending markets, but its performance may not be as robust in range-bound conditions. This is because of its tendency to generate false signals when there are no clear trends. To mitigate this issue, longer lookback periods can be used to improve the reliability of RVI’s signals.
In contrast, RSI works well for identifying overbought or oversold conditions and can provide early warning signs of potential trend reversals. However, it might not be as effective at providing precise entry and exit points in trending markets.
MACD is a versatile indicator that combines both trend-following and momentum features. It offers a clear visual representation of the underlying trend while also detecting divergences between price and signal lines to predict potential trend changes. Its adaptability makes it an excellent choice for various market conditions, including ranging and trending markets.
Ultimately, each indicator has its unique strengths and weaknesses, making them complementary rather than competitive tools in the technical analysis toolkit. A well-rounded investment strategy may involve using a combination of RVI, RSI, and MACD, along with other indicators and fundamental analysis techniques to maximize potential returns while minimizing risk.
In conclusion, institutional investors should familiarize themselves with RVI, RSI, and MACD to gain a comprehensive understanding of various momentum indicators and their applications in technical analysis. By comparing these indicators and understanding their unique strengths and limitations, investors can make more informed decisions and improve overall portfolio performance.
Use Cases: Real-World Examples of RVI Applications
The Relative Vigor Index (RVI) has proven itself as a valuable momentum indicator for institutional investors, with its unique approach to measuring the strength of a trend by comparing a security’s closing price to its trading range. This section provides real-world examples that illustrate the effectiveness of RVI in different market scenarios.
Example 1: Identifying Trend Reversals
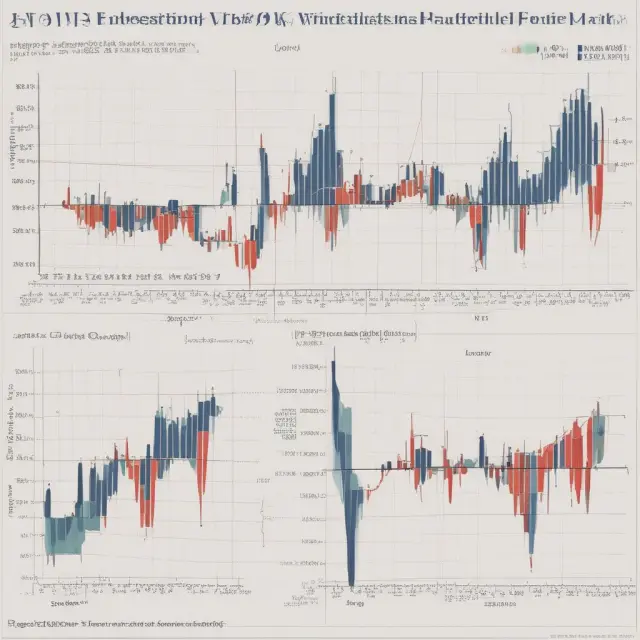
In this case study, we examine a well-known stock from the technology sector, which had been showing a strong uptrend for several months (Figure 1). However, upon closer inspection using the RVI indicator, signs of an impending reversal started to appear. As shown in Figure 2, the RVI line diverged from the price trend, signaling a potential change in direction. This divergence was confirmed when the stock experienced a significant price decline soon after, making it a prime selling opportunity for traders.
Figure 1: Uptrend in Technology Stock
Figure 2: RVI Divergence Signal
Example 2: Confirming Trend Continuation
In this instance, we look at an oil and gas stock that had been in a downtrend for several weeks (Figure 3). The RVI indicator confirmed the trend continuation by maintaining a consistent bearish signal over a prolonged period of time. As shown in Figure 4, the RVI line remained below its signal line throughout the downtrend, providing traders with a reliable sell signal and reinforcing their short position on the stock.
Figure 3: Downtrend in Oil and Gas Stock
Figure 4: Consistent Bearish Signal from RVI
Example 3: Spotting Rangebound Markets
In some cases, the RVI indicator can be less effective due to range-bound markets, where prices oscillate between support and resistance levels without forming a clear trend. In this example (Figure 5), the stock displayed erratic price movements, making it challenging for the RVI to generate consistent signals. Despite this challenge, an experienced trader could still make use of the RVI by focusing on specific entry and exit points during periods of trending behavior within the rangebound market.
Figure 5: Rangebound Market in a Financial Stock

Implementing the RVI: Setting Up the Indicator for Analysis
The Relative Vigor Index (RVI) is a powerful momentum indicator that offers unique insights into market trends, but how do you go about setting it up for analysis? Here’s a step-by-step guide to implementing the RVI on your preferred trading platform or charting software.
First, ensure your chosen platform supports the RVI indicator. Many popular trading platforms like MetaTrader and TradingView offer built-in support for this technical tool. If you’re using a less common platform, double-check its compatibility with the RVI before proceeding.
Once confirmed, select the security or asset class of interest within your platform. Next, navigate to the technical indicators section and search for the “Relative Vigor Index” option. You may need to install an add-on or extension if it’s not a built-in indicator. After installation, you’ll be prompted to input parameters like the time interval (daily, hourly, or minute) and the RVI period length, usually represented as ‘N’. Common choices range from 7 to 14 periods.
With the settings configured, click “Apply” or “Add” to add the indicator to your chart. The RVI will now appear as a new overlay on the price chart, typically displayed above or below it. The default settings include two additional lines: the signal line, and the centerline. The signal line is calculated using smoothed data from the numerator (closing price minus open) of the RVI formula, while the centerline represents the average of the RVI values for a specified period.
Keep in mind that some platforms may have different labeling conventions for these lines. In MetaTrader, for instance, the signal line is referred to as the “overbought” line, and the centerline is labeled as the “neutral” line. This discrepancy might lead to confusion if you’re using multiple charting tools or moving between different platforms.
Now that you’ve set up your RVI indicator, it’s time to learn how to read and interpret its signals for potential trade opportunities. In the next section, we will explore interpreting the Relative Vigor Index and understanding its importance in making informed investment decisions.

Common Mistakes in Using the Relative Vigor Index
The Relative Vigor Index (RVI) is a valuable tool for institutional investors seeking to identify trends and potential changes in trend within their investment portfolios. However, as with any technical indicator, it’s essential to understand how to correctly interpret RVI signals to avoid common pitfalls that can lead to suboptimal results or incorrect investment decisions.
1. Misinterpreting Divergences: When using the RVI to look for divergences between the indicator and the underlying security price, it is crucial not to jump into a trade immediately upon observing a discrepancy. Instead, consider confirming the trend reversal with additional indicators or chart patterns before making any investment decisions. Additionally, keep in mind that short-term divergences can be common, so it’s essential to consider the broader context of the market conditions and overall trend.
2. Over-Reliance on a Single Indicator: The RVI should not be used as the sole decision-making tool when evaluating investment opportunities. Instead, institutional investors are encouraged to incorporate multiple indicators or chart patterns for a more comprehensive understanding of market conditions and potential trends. This holistic approach can help investors avoid overreliance on any single indicator, which may lead to incorrect interpretations or missed opportunities.
3. Misjudging Crossovers: The RVI crossover signals can sometimes be misinterpreted due to their sensitivity to short-term market fluctuations and whipsaws. To mitigate this risk, consider using longer lookback periods when calculating the RVI values. This approach can help reduce false signals and improve the accuracy of the indicator in trending markets.
4. Misalignment with Trading Strategy: It’s essential to ensure that the investment strategy aligns with the RVI’s inherent characteristics and limitations. For instance, since the RVI is most effective in trending markets, institutional investors employing a short-term trading strategy may not find this indicator particularly useful due to its sensitivity to short-term volatility.
5. Neglecting to Adjust Parameters: The success of using RVI depends on setting appropriate parameters for the indicator calculation. While the default settings work well for most securities, specific market conditions or investment objectives might require adjustments. For instance, changing the N period can significantly impact the sensitivity and responsiveness of the RVI indicator.
By being aware of these common mistakes and understanding how to correctly apply the Relative Vigor Index, institutional investors can effectively identify trends and capitalize on opportunities in their portfolios.

Frequently Asked Questions about the Relative Vigor Index
The Relative Vigor Index (RVI) is a lesser-known but powerful momentum indicator used in technical analysis, providing valuable insights to institutional investors looking to understand market trends. Below, we answer some common questions regarding this intriguing oscillator.
What is the Relative Vigor Index (RVI), and how does it differ from other popular momentum indicators like RSI or MACD?
The RVI is a technical momentum indicator that measures the strength of a trend by comparing a security’s closing price to its trading range while smoothing the results using a simple moving average. Its key difference lies in its approach to calculating momentum, as the RVI focuses on comparing closing prices to open prices instead of low values for the RSI or crossovers for MACD.
In what timeframes can the Relative Vigor Index be used effectively?
The RVI can be applied to various timeframes, from minutes to months, depending on the investor’s objectives and market conditions. A shorter timeframe might suit day traders or short-term investors, while longer periods could benefit long-term investors or those focusing on broader trends.
What is the ideal setting for using the RVI indicator?
The RVI thrives in trending markets, as it effectively measures the strength of a trend by comparing closing prices to open prices. It tends to generate false signals in rangebound markets, where prices oscillate within a narrow band with minimal directional movement.
What are some common mistakes to avoid when using the Relative Vigor Index?
Some pitfalls include misinterpreting signals and over-relying on the RVI as a standalone indicator. It is crucial to use the RVI in conjunction with other forms of technical analysis, such as trendlines, chart patterns, and additional momentum indicators, to increase the odds of successful trades.
What are the advantages of using the Relative Vigor Index over other oscillators like Stochastic or RSI?
The RVI is a centered oscillator that moves around a center line rather than above or below it. Its ability to clearly identify trends and potential trend reversals makes it an attractive option for some traders, as its signals tend to be more straightforward and less prone to whipsaws compared to other popular momentum indicators.
To learn more about the Relative Vigor Index (RVI) and how it can be used effectively in your investment strategy, continue exploring our comprehensive guide.
 Next entry · No. 4,373Understanding Relevant Costs: A Managerial Accounting Perspective for Institutional Investors
See also
-
 No. 4,565
29 Jun 2025
21 min
Scalping: A High-Risk Trading Strategy for Profiting from Minor Price Changes
Finance Policy
No. 4,565
29 Jun 2025
21 min
Scalping: A High-Risk Trading Strategy for Profiting from Minor Price Changes
Finance Policy -
 No. 4,065
19 May 2025
20 min
Price Rate of Change (ROC) Indicator: Understanding Momentum in Finance
Financial Education
No. 4,065
19 May 2025
20 min
Price Rate of Change (ROC) Indicator: Understanding Momentum in Finance
Financial Education -
 No. 4,456
20 Jun 2025
20 min
Understanding Reversals: Spotting and Utilizing Trend Changes in Finance and Investment
Business Finance
No. 4,456
20 Jun 2025
20 min
Understanding Reversals: Spotting and Utilizing Trend Changes in Finance and Investment
Business Finance -
 No. 3,719
21 Apr 2025
21 min
Understanding and Leveraging the Opening Range in Trading
Business Finance
No. 3,719
21 Apr 2025
21 min
Understanding and Leveraging the Opening Range in Trading
Business Finance -
 No. 1,992
01 Dec 2024
22 min
The Comprehensive Guide to Understanding and Utilizing the Guppy Multiple Moving Average (GMMA) in Finance and Investment
Business Finance
No. 1,992
01 Dec 2024
22 min
The Comprehensive Guide to Understanding and Utilizing the Guppy Multiple Moving Average (GMMA) in Finance and Investment
Business Finance -
 No. 5,738
03 Oct 2025
18 min
Understanding Williams %R – A Powerful Momentum Indicator for Technical Analysis
Markets
No. 5,738
03 Oct 2025
18 min
Understanding Williams %R – A Powerful Momentum Indicator for Technical Analysis
Markets