Understanding the Concepts and Application of Gann Fans in Technical Analysis
Discover the importance of Gann Fans in technical analysis, learn how to calculate them & interpret their significance for forecasting support and…
Introduction to Gann Fans
Gann fans, invented by W.D. Gann in the 1930s, represent a unique approach to analyzing market trends through geometric patterns. These patterns consist of angled lines called Gann angles and are drawn over price charts to help identify support and resistance levels. By understanding Gann fans’ purpose and significance within technical analysis, investors and traders can make informed decisions based on this powerful tool.
Section Title: Understanding the Basics of Gann Fans
Gann fans consist of a series of lines or angles superimposed over price charts to illustrate potential areas where the market may find support or resistance. These angles are based on the notion that markets move in geometric and cyclical ways, and they can help investors and traders anticipate future trends. Gann believed the 45-degree angle was the most important, but fans also incorporate angles at various degrees ranging from 1:8 to 8:1.
The Gann fan’s origins can be traced back to W.D. Gann, an early market technician who developed several technical analysis tools and techniques still used by traders today. He claimed that markets followed specific mathematical ratios, and his fans are a reflection of those beliefs. The name “Gann fan” comes from how the lines spread out in a fan-like manner as they extend from the starting point on the chart.
Section Title: Key Components and Calculation of Gann Fans
To calculate a Gann fan, traders first need to choose a starting point on their price chart—either a significant trend reversal or an established support/resistance level. From there, the angles are drawn at varying degrees based on the price-to-time ratio (also known as time-price ratio). The most commonly used angles include those based on 1:1, 2:1, and 3:1 ratios, with others available depending on the charting platform or individual trader’s preference.
The Gann fan is typically initiated with a 45-degree line (the central angle), which represents a one-to-one price-to-time ratio. This starting point aligns with W.D. Gann’s belief in the balance between time and price. Additional lines are drawn above and below this central angle, and their degree angles follow specific ratios such as 2:1, 3:1, or others.
Section Title: Interpreting and Utilizing Gann Fans for Trading Strategies
Interpreting a Gann fan involves understanding the significance of the lines drawn in relation to current market trends. Traders can identify potential support and resistance levels by examining where these angles intersect with price movements. The belief is that if the price breaks through one angle, it may move towards the next angle, which can help inform entry or exit points for a trade.
Gann fans can be useful for various securities such as stocks, commodities, indices, and currencies. They can also serve as complementary indicators when used alongside other technical analysis tools like moving averages, trendlines, or oscillators. By combining these techniques, traders can build a more comprehensive understanding of the market dynamics and make better-informed decisions.
In conclusion, Gann fans provide an intriguing perspective on identifying potential support and resistance levels based on the geometric relationship between time and price. Although not a perfect tool, they can be valuable additions to any technical analysis arsenal when combined with other indicators and a thorough understanding of market conditions.
History of Gann Fans
The concept of Gann fans originated from W.D. Gann, a renowned market technician hailing from the early 20th century. Believing that markets are both geometric and cyclical in nature, he introduced this innovative tool to assist traders in identifying support and resistance levels based on historical price movements.
Gann fans consist of a series of angles that form an extension of potential future price movements. The most significant angle, as per Gann’s theories, is the 45-degree line, which is also known as the 1:1 ratio because the price ascends or descends at a 45-degree angle when it moves one unit for each unit of time.
Incorporating the idea of price-to-time moves, Gann fans include various angles with ratios like 1:2, 1:3, 1:4, and so on. Gann believed that once a significant price move occurred in these specific ratios, it would often lead to further potential price movements within the same ratios.
To construct a Gann fan, one starts by selecting a historical reversal point, such as a swing high or low. From there, lines are drawn at various angles above and below the 45-degree line, which extends from that specific turning point. Each angle represents a different time-to-price ratio and is used to identify potential support and resistance levels in the future.
Gann fans are versatile tools as they can be applied to various types of securities, such as stocks, currencies, commodities, or futures. They are most effective when used in conjunction with other technical indicators, price action analysis, and market sentiment to gain a more comprehensive understanding of the underlying trend and potential turning points.
The origins of Gann fans can be traced back to the 1920s, but they gained significant popularity during the bull run from 1982 to 1987 and continue to be a valuable resource for traders in today’s financial markets.
Calculating Gann Fans
Gann fans are an essential tool in the arsenal of a technical analyst who aims to forecast future market trends based on historical price patterns. These tools provide traders with insight into potential support and resistance levels by employing a series of angles derived from W.D. Gann’s theories regarding balance between time and price. In this section, we delve deeper into the calculations behind creating Gann fans and understanding their slope degrees.
To calculate Gann fans, you don’t necessarily require a formula, but a solid grasp of slope degrees is crucial. Imagine a graph paper filled with tiny squares or grids. If the price rises to match the height of one square within the span of one time unit, a line can be drawn from the bottom-left corner to the top-right corner of that square. The angle of this line will correspond to 45 degrees.
Now consider situations where the price ascends the height of two squares (or boxes) in the time frame of only one box. In this case, the line’s angle will be flatter than 45 degrees. Alternatively, when the price rises by two boxes’ height within a single-box time frame, the angle will be steeper than 45 degrees.
Gann fans utilize angles based on various price-to-time ratios, namely: 1:8, 1:4, 1:3, 1:2, 1:1, 2:1, 3:1, 4:1, and 8:1. According to Gann, the ideal angle for charting is the 45-degree angle due to his belief that the balance between price and time is crucial.
To create a Gann fan, the trader chooses a specific starting point and extends lines in various angles derived from these ratios, forming a fan-like diagram. The central line of this fan will be the 45-degree angle (1:1), and all other lines are drawn above or below it, depending on the desired ratio.
To draw a Gann fan, begin by determining the starting point – usually at a significant trend reversal level. Set the central 45-degree line based on this point. All additional lines are then drawn above and below the central line according to the chosen ratios (1:8, 1:4, etc.).
The importance of Gann fans lies in their ability to help determine trend direction and strength by identifying potential support and resistance levels. In both uptrends and downtrends, these lines can serve as valuable reference points for assessing the health of a market trend. Additionally, traders may use a varying number of lines depending on their preferences and the specific asset being analyzed.
By understanding the concept of slope degrees and how to calculate Gann fans, traders can effectively incorporate this powerful tool into their technical analysis approach. In the next section, we will examine the components of a Gann fan diagram and how to interpret its various elements.
Components of a Gann Fan Diagram
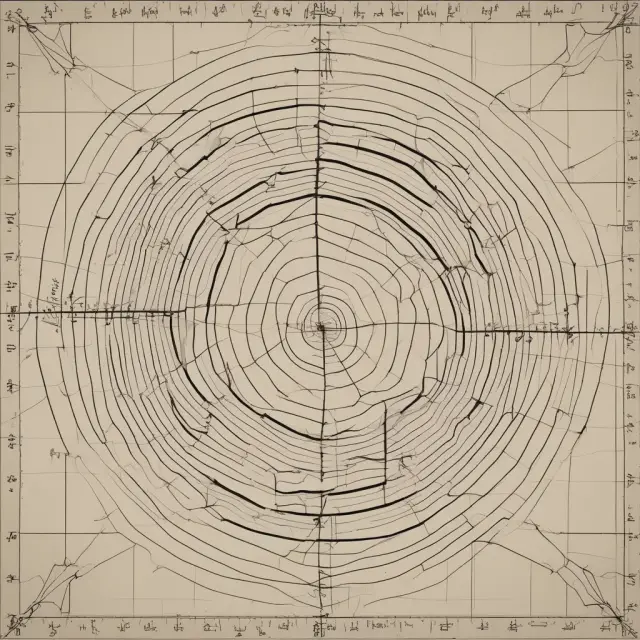
A Gann fan is a technical analysis tool that consists of a series of angled lines drawn from a central 45-degree angle to determine trend direction and identify potential support and resistance levels. Created by W.D. Gann, this method relies on the belief that market movements follow specific angles or degrees.
The key component of a Gann fan is the 45-degree line, also known as the central angle or the 1:1 line. This line represents the ideal balance between time and price, as each unit of price change corresponds to one unit in the time frame. The 45-degree angle can be located by aligning it with a degree angle tool on your charting platform.
Gann fans extend above and below this central line using degrees based on specific price-to-time moves. These angles include 82.5, 75, 71.25, 63.75, 26.25, 18.75, 15, and 7.5 degrees, with the most significant angle being the 45-degree line itself. The number of lines drawn above and below the central line is subjective and depends on the trader’s preferences.
The additional angles in a Gann fan are also used as potential support and resistance levels. For instance, if a price falls below the 1:1 line (45-degree angle), it might find support at the next lower angle before potentially continuing its upward trend. Similarly, if a price breaks above the 1:1 line, it may face resistance at the next higher angle before potentially reversing direction.
The significance of these angles and their potential impact on market movements is rooted in W.D. Gann’s theories about the balance of time and price. By analyzing historical price data, traders can use this information to anticipate future price trends and identify possible support and resistance levels.
Understanding the components of a Gann fan diagram is essential for investors and traders looking to employ this powerful technical analysis tool effectively. As with any other charting tool, it should be used in conjunction with other indicators, price action, and fundamental analysis for more comprehensive market insights.
Interpreting Gann Fans
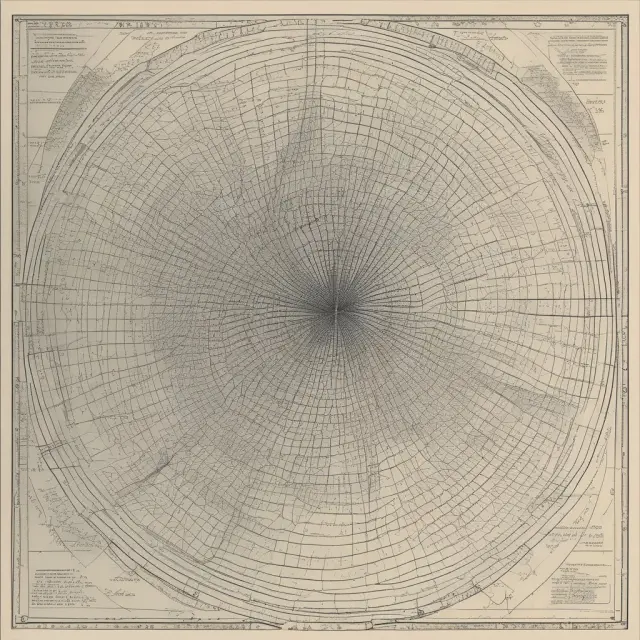
Gann fans are an essential tool for interpreting trends, support, and resistance levels within the context of a time-price chart. Developed by W.D. Gann, they offer technical analysts valuable insights into potential market movements through the application of specific angles. In this section, we’ll discuss approaches to reading Gann fans effectively.
First, it’s important to understand that Gann fans consist of various angled lines extending from a central 45-degree line based on W.D. Gann’s theories regarding time and price ratios. The 1:1 line or the central 45-degree angle is critical as it represents equilibrium between price and time.
To interpret Gann fans, traders look for significant price levels that coincide with the angles formed by the lines drawn above and below the 1:1 line. When price interacts with these angles, they can provide valuable information regarding support and resistance levels, trend direction, and potential future moves.
When the price is below the 1:1 line, it may be considered bearish; conversely, when it’s above the 1:1 line, it’s bullish. However, a break of the 1:1 line doesn’t necessarily mean the trend has reversed entirely. Instead, it could signal short-term weakness or strength depending on the angle and other factors.
For example, if the price falls below the 26.25-degree angle (2:1), it may indicate a potential reversal or a correction before continuing its uptrend. Conversely, a rise above the 180-degree angle (1:1.36) could suggest a bullish continuation.
It is important to remember that Gann fans should not be used in isolation but rather alongside other technical analysis tools and price action to provide a more comprehensive perspective on market dynamics. By combining multiple indicators, traders can improve the accuracy of their forecasts and enhance their overall understanding of the market.
Additionally, it’s worth noting that not every market condition may produce significant interactions with Gann fan angles or yield reliable trading signals. As such, experienced chartists employ a discerning approach when applying this technique, considering factors like market conditions, volume, and other confirming indicators to ensure the validity of potential entry and exit points.
In conclusion, Gann fans offer valuable insights into identifying trend direction and support/resistance levels through specific angles based on price-to-time moves. To effectively interpret these angles, traders should consider market conditions, volume, and other confirming indicators to maximize the predictive power of this powerful technical tool.
Advantages of Using Gann Fans
Gann fans are widely recognized for their potential to provide long-term forecasts when applied correctly. This powerful tool can help traders identify trend direction and assess possible support and resistance levels based on the historical price movements. W.D. Gann, an early market technician and developer of this technique, believed in the balance between time and price and considered the 45-degree angle to be essential for charting.
The primary advantage of Gann fans is their ability to illustrate trend direction. In a bullish trend, prices consistently rise above the central 1:1 line (the 45-degree angle), while bearish trends display prices below this line. By using multiple lines drawn at different angles, chartists can determine the strength and potential future direction of the prevailing trend.
Gann fans also help traders identify potential support and resistance levels. The price action tends to respect these levels before reversing or forming a significant move. For instance, if the price falls below the 1:1 line but finds support at a lower angle (such as the 2:1), it may represent a temporary correction before continuing in the overall trend.
Another advantage of using Gann fans is their adaptability to various time frames and securities. Chartists can apply this technique on different charts for stocks, currencies, commodities, or indices, making it an essential tool for multifaceted traders. Furthermore, by combining Gann angles with other indicators or techniques such as Fibonacci retracement levels, chart patterns, or pivot points, analysts can enhance their accuracy and make more informed decisions.
Additionally, Gann fans offer a unique perspective on market cycles. By analyzing the relationship between time and price at different degrees, traders may uncover repeating patterns in the financial markets, which could lead to profitable trading opportunities or risk management strategies.
Despite their numerous advantages, it’s important to remember that no single analysis tool can guarantee success. Gann fans should be used as a complementary part of an overall technical strategy and not relied upon exclusively for making decisions in the financial markets. As with any charting method, it’s crucial to be aware of the limitations and potential pitfalls, such as incorrectly interpreting angles or overlooking other significant factors that may influence price movements.
Comparing Gann Fans and Trendlines
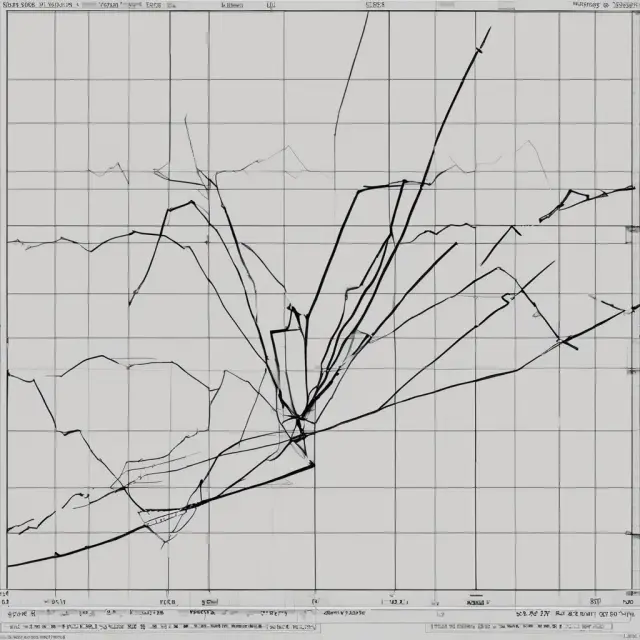
The comparison between Gann fans and trendlines is a popular topic within the trading community due to their shared role in identifying trend direction and potential support or resistance levels. Both methods employ angled lines on a chart, but they differ significantly in how these lines are calculated and used. In this section, we’ll delve deeper into understanding the differences between Gann fans and trendlines.
First, it is essential to note that a Gann fan consists of a series of angles (Gann angles) drawn from a central 45-degree line extending outwards on a chart. This line is considered the primary support or resistance level for the price movement. A trendline, alternatively, is formed by connecting consecutive swing highs or lows with a single line and can have varying degrees of angles depending on the trend direction (uptrend or downtrend).
Now let’s explore their key differences:
1. Calculation Method
Gann fans rely on specific slope degrees based on price-to-time moves, while trendlines are created by connecting the swing highs and lows based on visual analysis of the market data.
2. Angles and Interpretations
Gann angles extend outwards at various degrees (1:1, 1:2, 1:3, etc.) from a central 45-degree angle, which is considered the primary indicator level. Trendlines, on the other hand, do not have predefined angles but are determined based on the existing trend direction and swing points.
3. Predictive Value
Gann fans aim to provide long-term forecasts by predicting future support or resistance levels based on historical price data and specific angle relationships. In contrast, trendlines offer short-term insights into the market’s trend direction and potential reversals by connecting previous swing points.
4. Adjustments
Gann fans require more adjustments as new data emerges to update the angles, while a trendline typically only requires occasional updates when there are significant changes in the market trend or price behavior.
5. Flexibility
Trendlines can be applied to any timeframe (minutes, hours, days, weeks, months), whereas Gann fans are usually considered more suitable for higher timeframes due to their long-term nature and potential limitations on lower timeframes.
In conclusion, understanding the differences between Gann fans and trendlines is crucial for traders aiming to incorporate these technical analysis methods effectively in their trading strategies. By recognizing the strengths and weaknesses of both approaches, traders can optimally blend them to maximize their potential for identifying trends, support, and resistance levels while minimizing the limitations of each technique.

Limitations of Using Gann Fans
While Gann fans can provide valuable insights into potential support and resistance levels based on historical price movements, it’s essential to understand their limitations as a standalone tool in technical analysis. Here are some potential concerns associated with using Gann fans:
- Scaling: Since different assets have varying prices and timeframes, the application of Gann fans may not be consistent across all financial instruments. Scaling issues can make it difficult to set the 45-degree line at a true 45-degree angle on certain charts, compromising the accuracy and effectiveness of the tool.
- Price disregard: The price might not always respect or reach support or resistance levels indicated by Gann fans. In some instances, prices may stay within the fan area without touching the lines, while in others, they may break through them entirely.
- Overlapping lines: As time progresses, the lines in a Gann fan diagram continually spread out, making it increasingly difficult to identify actionable trading signals or levels as the distance between the lines grows larger.
- Inconsistencies across charts: The performance of Gann fans can differ significantly from one chart to another due to various factors such as timeframes, volatility, and market conditions. This inconsistency makes it challenging for traders to rely on them as a definitive tool for making trading decisions.
- Limited accuracy: Gann fans are not infallible predictors of price movements, and their accuracy can be limited in various situations. While they can help identify potential support and resistance levels, prices may deviate from these levels, necessitating the use of additional indicators and analysis techniques to confirm trends and make informed trading decisions.
To overcome the limitations of Gann fans, it’s recommended that traders combine them with other technical indicators, such as moving averages or momentum oscillators, and price action analysis. By combining multiple tools, traders can increase their chances of identifying accurate signals and making informed trading decisions based on a more comprehensive understanding of market trends and conditions. Additionally, setting realistic trading objectives, managing risk effectively, and staying abreast of market news and developments are essential components of any successful trading strategy.

Gann Fans and Trading Strategies
A key aspect of using Gann fans effectively is integrating them into trading strategies. By combining the fan angles with price patterns and volume data, traders can create robust strategies to identify entry and exit points. This section will discuss the application of Gann fans in various securities such as stocks, indices, currencies, and commodities.
Stocks
To employ Gann fans in stock trading, investors follow the same steps for calculating angles and support/resistance levels. However, the time frame selected might depend on the stock’s volatility and the trader’s investment horizon. For instance, a longer-term investor may use monthly charts, while a short-term trader can benefit from daily or hourly charts. Once identified, traders can enter a position when price tests support or resistance levels.
Indices
For indices like the S&P 500, Gann fans can provide valuable insights into significant trends and potential reversals. Analyzing major indices using weekly or monthly time frames allows for broader trend analysis. Identified angles can act as crucial turning points, aiding traders in making informed decisions regarding their portfolio allocations.
Currencies
Foreign exchange markets present unique challenges due to the volatility and liquidity inherent in currency pairs. Gann fans prove useful in identifying key support and resistance levels for major currency pairs like EUR/USD or USD/JPY. Traders can use this information for scalping, day trading, or positioning themselves in the market based on trends.
Commodities
Investors and traders dealing with commodities such as gold, crude oil, or natural gas can employ Gann fans to identify long-term trend directions and potential reversals. By plotting fan angles on weekly or monthly charts, these traders can determine significant price levels that might serve as entry/exit points for their trades.
In conclusion, Gann fans offer a powerful toolset for technical analysis, but they are not foolproof. Combining them with other indicators and analysis methods increases the chances of success. By understanding the strategies behind Gann fan applications in various securities, traders can create well-rounded trading plans to capitalize on market movements effectively.
FAQ
What is a Gann Fan, and How Does It Work?
A Gann fan is a powerful technical analysis tool that helps traders and investors identify potential support and resistance levels based on the geometry and cyclical nature of financial markets. Developed by W.D. Gann in the early 20th century, it consists of a series of angled lines called “Gann angles,” which are drawn from a central 45-degree line extended from a significant trend reversal point. These lines provide insights into trend direction and potential future price movements.
Understanding the History of Gann Fans
W.D. Gann, an influential financial market technician and trader, introduced the concept of Gann fans in the 1900s as part of his broader body of work on charting techniques and market theory. The tool gained popularity among traders seeking to better understand the markets and make informed decisions.
Calculating and Creating a Gann Fan
To calculate a Gann fan, first identify a key trend reversal point, such as a significant high or low. Then, apply the slope degrees associated with price-to-time moves (1:8, 1:4, 1:3, 1:2, etc.) to create angled lines above and below the central 45-degree line. The result is a fan diagram that illustrates potential future support and resistance levels.
Components of a Gann Fan Diagram
A typical Gann fan consists of the following components:
- Central 45-degree line (1:1 line)
- Additional lines drawn above and below the central line
- Various angles based on time-to-price moves (2:1, 3:1, etc.)
Each line within a Gann fan acts as a potential support or resistance level, providing insights into market trends and potential turning points.
Interpreting Gann Fans for Trading
To interpret the information provided by a Gann fan, traders should look for price interactions with the lines to confirm support and resistance levels. Additionally, the angles can indicate trend direction and strength, potentially signaling upcoming reversals or continuation of existing trends.
Comparing Gann Fans and Trendlines
Gann fans differ from traditional trendlines in their angle-based construction. While trendlines typically connect price highs or lows, Gann fans provide a more consistent diagonal representation of potential support and resistance levels. Both tools can be used together to enhance overall analysis.
Limitations of Using Gann Fans
It’s essential to remember that Gann fans do not always perfectly predict market movements. They should be considered just one part of a comprehensive analysis strategy, alongside other indicators, price action, and fundamental factors. Additionally, their use is limited on charts where the angle tool for setting the 45-degree line accurately may not be available.
Conclusion: Gann fans offer traders valuable insights into market trends and potential support and resistance levels based on historical price movements and geometrical patterns. By understanding its origins, calculations, and applications, you can effectively employ this tool to enhance your trading strategy.
 Next entry · No. 1,735Understanding Gann Angles: Predicting Price Movements in Finance and Investment
See also
-
 No. 892
26 Jun 2024
17 min
Decoding the Death Cross: Understanding This Market Indicator’s Significance and Limitations
Markets
No. 892
26 Jun 2024
17 min
Decoding the Death Cross: Understanding This Market Indicator’s Significance and Limitations
Markets -
 No. 1,297
26 Aug 2024
19 min
Understanding Envelopes in Technical Analysis: Identifying Trading Opportunities with Moving Average Envelopes
Financial Tools
No. 1,297
26 Aug 2024
19 min
Understanding Envelopes in Technical Analysis: Identifying Trading Opportunities with Moving Average Envelopes
Financial Tools -
 No. 1,104
28 Jul 2024
17 min
Understanding Doji: A Technical Analysis Tool for Identifying Price Reversals
Financial Tools
No. 1,104
28 Jul 2024
17 min
Understanding Doji: A Technical Analysis Tool for Identifying Price Reversals
Financial Tools -
 No. 4,915
27 Jul 2025
20 min
Technical Analysis 101: A Comprehensive Guide for Institutional Investors
Financial Education
No. 4,915
27 Jul 2025
20 min
Technical Analysis 101: A Comprehensive Guide for Institutional Investors
Financial Education -
 No. 4,412
16 Jun 2025
21 min
Understanding Resistance Levels in Technical Analysis: Identifying, Trading and Breaking Through
Markets
No. 4,412
16 Jun 2025
21 min
Understanding Resistance Levels in Technical Analysis: Identifying, Trading and Breaking Through
Markets -
 No. 3,941
09 May 2025
17 min
Understanding Pennants: A Technical Analysis Continuation Pattern
Financial Education
No. 3,941
09 May 2025
17 min
Understanding Pennants: A Technical Analysis Continuation Pattern
Financial Education