Understanding Doji: A Technical Analysis Tool for Identifying Price Reversals
Learn about the significance of Doji, a popular technical analysis tool used for identifying price reversals. Explore various types, interpretations, and…
Introduction to Doji
Doji, a term derived from Japanese, refers to a unique technical analysis tool used by investors to identify potential price reversals in financial markets. The term ‘doji,’ which means ‘same thing’ in Japanese, is given to this particular candlestick pattern due to the open and close prices being almost identical. In essence, dojis are characterized as having a small or non-existent real body between the open and close price, giving the appearance of a cross or a plus sign on charts. This section will delve deeper into understanding the concept of doji, its origin, significance, and various types.
Understanding the Structure of a Doji Candlestick:
A doji candlestick is formed when the open and close prices are virtually equal in financial instruments such as stocks or currency pairs. The structure comprises two significant components:
– Upper shadow: The upper shadow, also known as the wick or tail, represents the difference between the highest traded price and the close.
– Lower shadow: The lower shadow shows the difference between the lowest traded price and the open.
Doji candlesticks are essential indicators for technical analysts, providing valuable insights into market sentiment, potential price reversals, and periods of consolidation. They signal indecision among buyers and sellers, implying that neither side has gained clear dominance over the other. This often occurs during critical junctures in the market cycle or when prices are experiencing high volatility.
Three Types of Doji:
Dojis come in three distinct types based on their appearance and potential implications. Understanding these various forms can help traders gauge the market’s sentiment more effectively, as each type conveys different messages.
- Gravestone Doji: This type of doji has a small real body that is typically below the open and close prices with long lower and upper shadows. A gravestone doji suggests a bearish reversal when it appears at the end of an uptrend, signaling that sellers have entered the market and pushed prices downward.
- Long-Legged Doji: Also called Tengen or Invisible Doji, a long-legged doji has relatively larger upper and lower shadows compared to its small real body. The appearance of this pattern usually implies indecision among buyers and sellers in the market. It can be seen at the end of an uptrend, signaling potential consolidation or continuation of the existing trend.
- Dragonfly Doji: A dragonfly doji is characterized by a small real body that is typically above the open and close prices with long upper and lower shadows. This pattern suggests a bullish reversal when it appears at the end of a downtrend, signaling that buyers have entered the market and pushed prices upward.
In the next sections, we will explore each doji type’s significance, implications, and interpretation in more detail. Stay tuned!
Understanding the Structure of a Doji Candlestick
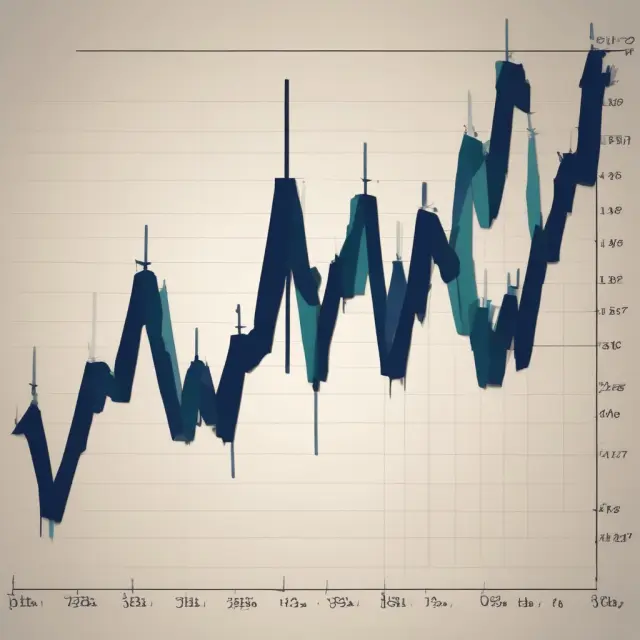
A Doji, derived from the Japanese term “dōji,” which translates to ‘the same thing,’ is an intriguing yet rare occurrence in financial markets that represents equal open and closing prices for a single trading session. The visual representation of this phenomenon can be observed within candlestick charts, where Doji appears as a cross or plus sign, featuring minimal or no body and two equally long shadows (open and close). In the realm of technical analysis, Doji is interpreted to provide vital insights into market sentiment and potential price reversals.
At its core, a Doji candlestick indicates indecision among traders, as neither buyers nor sellers gain an upper hand in setting the day’s trading range. This neutral sign can be seen as a standoff between market participants, who have similar buying and selling pressures, leading to a price stalemate.
A Doji is characterized by its unique structure, which consists of the following components:
- Open Price (OP): This value represents the price level at the start of the trading session.
- Close Price (CP): The price at which the trading session concludes.
- High Price (HP): The highest price reached throughout the day’s trading activity.
- Low Price (LP): The lowest price recorded during a particular trading session.
When these prices align, it results in a Doji candlestick with negligible or no body and equal open and closing prices. Although Doji may appear as a sign of indecision, they can also act as potential indicators for future price movements, especially when used in conjunction with other technical analysis tools.
A doji formation occurs when the following conditions are met:
- Open Price = Close Price
- High Price > Open Price > Low Price
- The body (the space between open and close prices) is negligible or absent
Doji can be further classified into three distinct types, each offering unique insights into market behavior: Gravestone Doji, Long-Legged Doji, and Dragonfly Doji. In the following sections, we will dive deeper into these classifications, discussing their significance and potential implications for investors.

Three Types of Doji: Gravestone, Long-Legged, and Dragonfly
Doji is a significant candlestick pattern that signals potential trend reversals or indecision in the market. In this section, we will dive deeper into understanding different types of dojis: gravestone, long-legged, and dragonfly doji.
1. Gravestone Doji:
A gravestone doji appears when a security’s open, high, low, and close prices are almost equal with a long lower shadow (wick) but a negligible or no upper wick. This pattern indicates that the buyers were unable to push the price above the opening, resulting in a bearish sentiment. The presence of a gravestone doji suggests that sellers are taking control of the market and that a potential downtrend may occur. Traders might use this as an opportunity to short sell or exit long positions.
2. Long-Legged Doji:
A long-legged doji, on the other hand, is characterized by long upper and lower shadows, with open, high, low, and close prices relatively close together. This pattern represents indecision in the market, indicating neither buyers nor sellers have control over the security’s price. It could be a pause within an existing trend or a potential reversal depending on the context.
3. Dragonfly Doji:
The rarest among the three, a dragonfly doji forms when a security’s open, high, low, and close prices are almost equal, but with a long upper wick and no or very short lower shadow. This bullish pattern indicates that buyers were able to push the price above the opening, leading to optimistic sentiment among traders. The presence of a dragonfly doji signals a potential uptrend in the future.
In conclusion, understanding these different types of Doji can help investors make more informed decisions when trading securities based on their technical analysis. It is important to remember that these patterns should be used as part of a larger strategy and not solely relying on them for investment decisions. Combining these patterns with other technical indicators can increase the reliability and accuracy of the analysis.

What Does a Doji Tell Investors?
The intriguing aspect of the Doji candle is its ambiguous nature, which can lead to varying interpretations and potential trading opportunities for investors. When the open and close price of an asset are almost identical, it implies that there was no significant net movement during the trading session. This can be observed as indecision within the market or a stalemate between buyers and sellers.
From a psychological standpoint, Doji signals a balance in supply and demand forces, where neither side gains control over price action. As such, it can be a crucial indicator for traders looking to identify potential trend reversals or continuations. Let’s dive deeper into what a Doji could mean for investors:
Market Sentiment
One of the primary uses of a Doji is determining market sentiment. In Japanese, “doji” (どうじ/ 同事) means ‘the same thing,’ reflecting the equal open and close prices of a security. If buyers and sellers are both reluctant to push the price in any direction, it can be seen as a reflection of overall neutral or uncertain sentiment regarding the asset.
Price Reversals
Some analysts argue that Doji signals a potential trend reversal due to its indecisive nature. For instance, if an uptrend is followed by a Doji candle, it could indicate that the bullish momentum has weakened or even reversed. Conversely, a downtrend preceded by a Doji can signify that bearish sentiment may be losing steam and a bullish reversal might follow.
However, it’s essential to note that a single Doji doesn’t guarantee a price reversal; instead, it serves as a potential indicator of one. Traders should use other technical indicators and confirming signals to validate their assumptions before making investment decisions based on Doji patterns.
Indecision and Price Action
The appearance of a Doji can also be interpreted as a pause in an ongoing trend or consolidation period. For instance, if a strong uptrend is followed by a long-legged Doji, it could signify that the price may take some time to continue its upward trajectory. Conversely, a bearish trend preceded by a gravestone Doji might indicate that the price needs more time before resuming its downturn.
In summary, a Doji is an intriguing candlestick pattern that can provide valuable insight into market sentiment and potential price reversals. By understanding its structure, types, and implications, investors can make informed decisions and capitalize on trading opportunities.

The Difference Between Doji and Spinning Top
When it comes to analyzing candlestick charts for potential price reversals, understanding the difference between doji and spinning top can provide valuable insights for traders. Although both patterns show that buying and selling pressures are roughly equal, they carry distinct interpretations and implications.
Doji, a term derived from the Japanese word meaning “the same thing,” represents a trading session where the security’s opening and closing prices are almost identical. As illustrated earlier in our article on understanding doji, these candlestick formations appear like crosses, inverted crosses, or plus signs with small bodies or no body at all. Technically, for a candlestick to be classified as a doji, its body must represent less than 5% of the entire range between the open and close prices.
On the other hand, spinning tops are characterized by larger bodies compared to doji, where the opening and closing prices are relatively close but still show some price movement. Spinning tops can be seen as a neutral indication, suggesting a potential continuation or reversal of an existing trend depending on the context. Although similar, spinning tops differ from doji in their body size and potential interpretations.
From a technical standpoint, both doji and spinning tops show indecision in the market, indicating that neither buyers nor sellers have sufficient strength to push the price significantly higher or lower. However, investors should be aware that these patterns are not foolproof indicators of trend reversals; they often require confirmation from other technical analysis tools like moving averages, Bollinger Bands, and momentum indicators before making any investment decisions.
Additionally, understanding the context in which doji or spinning tops appear is crucial for accurately interpreting their significance. For instance, a doji pattern that forms after a prolonged uptrend could signal a potential reversal, while a spinning top during a downtrend may indicate a potential trend continuation. In both cases, traders should look to other technical indicators and chart patterns for confirmation before making any trade decisions.
In conclusion, doji and spinning tops are essential tools in the world of technical analysis for identifying market indecision, potential price reversals, or continuing trends. While they may appear similar at first glance, their differences lie in the body size and interpretation, requiring traders to evaluate other indicators for a well-informed investment strategy.
Doji Limitations: Price Reversal, Reliability, and Stop-Loss Placement
While the doji candlestick is a significant technical analysis tool for predicting potential price reversals, it’s essential to understand its limitations. Doji patterns can indeed be powerful indicators, but they are not infallible, and their interpretations require careful consideration.
First and foremost, doji may signal indecision rather than an impending trend reversal. During times of consolidation or sideways movement in the market, doji might appear frequently without any significant price changes. In such cases, investors should be cautious not to misinterpret a doji as a reliable indication of a trend reversal.
Secondly, relying solely on doji for making investment decisions can lead to suboptimal outcomes. The low reliability and ambiguity of these patterns necessitate the use of other confirming indicators in conjunction with the doji to strengthen the accuracy and robustness of investment decisions. Examples of such indicators include moving averages, trend lines, and various momentum oscillators.
Lastly, stop-loss placement can be a challenge when using the doji for setting entry points. A doji’s long wick or tail might indicate an extended reach from the current market price, making it difficult to determine where to place a stop-loss. Traders might need to consider employing alternative entry strategies such as placing an order at a predetermined price level based on other technical indicators like moving averages.
To maximize the potential benefits of using doji and minimize its limitations, investors should approach this tool with a well-rounded perspective that considers market conditions, other technical analysis tools, and a solid understanding of risk management.
Additionally, it’s essential to remember that doji can come in different forms such as gravestone doji, long-legged doji, or dragonfly doji, each with unique characteristics and implications for investors. Familiarizing oneself with the various types of doji and their significance will help traders make more informed decisions when using this technical analysis tool.

Identifying a Dragonfly Doji and Its Significance
A dragonfly doji, also known as mieru bochi in Japanese, is an intriguing candlestick pattern that captures the attention of technical analysts when they observe it on their charts. This unique configuration consists of a tiny real body, with both the open and closing prices being virtually equal and very close to each other. The term “dragonfly” arises due to the presence of long upper and lower wicks or shadows. This pattern can signify significant market indecision, as well as potential reversal opportunities.
Dragonfly Doji Structure
A dragonfly doji is characterized by its small real body, which is surrounded by long upper and lower wicks (shadows). The open, high, low, and close prices are typically very near to each other. This pattern suggests that the market has been unable to establish a clear direction during the trading session.
Significance:
Dragonfly dojis often occur when there is significant volatility but little net change in price. The long upper and lower wicks indicate that there were strong buying and selling pressures at certain levels, but neither managed to gain control of the trend. This indecision can result in a potential turning point for the security’s price direction.
Dragonfly Doji vs Reversal
Not all dragonfly dojis signify a reversal. In some cases, this pattern might indicate continuation of an existing trend, but it is typically seen as a bullish signal when it occurs in an uptrend and a bearish signal when it appears during a downtrend. When the dragonfly doji emerges after a significant price move (either up or down), it can be considered as a potential reversal indicator.
Dragonfly Doji vs Spinning Top
It is essential to differentiate between a dragonfly doji and a spinning top, another candlestick pattern with similar characteristics but distinct differences. While both patterns exhibit long wicks and a small real body, the key difference lies in the length of the upper and lower wicks. A spinning top has a longer real body than its upper or lower shadows, whereas the dragonfly doji features nearly equal-length upper and lower wicks. The presence of long upper and lower wicks in a dragonfly doji indicates stronger buying and selling pressures that make this pattern more significant for potential price reversals.
Practical Application
Technical traders may employ several methods to use the dragonfly doji as a potential signal for entering or exiting trades. One popular strategy involves placing a buy order when a bullish dragonfly doji emerges in an uptrend, and setting a stop loss just below the lower wick. Conversely, they can place a sell order when observing a bearish dragonfly doji in a downtrend, with a stop loss above the upper wick. However, it is essential to remember that no pattern offers a foolproof indication of future price movements, and traders should consider additional factors before making any trading decisions.
Dragonfly Dojis are fascinating candlestick patterns, providing valuable insights into market sentiment and potential price reversals. By understanding the structure, significance, and differences between dragonfly dojis and other technical indicators, traders can enhance their analysis skills and make more informed decisions in the financial markets.

Understanding a Gravestone Doji and Its Implications
The Gravestone Doji is a powerful yet underappreciated candlestick pattern that carries significant weight in the technical analysis community. It appears as a near-perfect rectangle with a long upper wick, symbolizing a strong bearish reversal indication for traders. Understanding this candlestick formation’s structure and interpretation is crucial to recognize potential opportunities or risks when trading securities.
Features of Gravestone Doji
The Gravestone Doji’s defining characteristic lies in its distinct shape, consisting of a short real body and long upper wick (shadow). This pattern is created when the open, high, low, and close prices are as follows: the opening price equals or comes very close to the closing price, while the highest price during the trading session reaches significantly higher levels than both the opening and closing prices.
Interpretation of Gravestone Doji
The Gravestone Doji’s meaning can be deciphered from two primary perspectives. From an auction theory point of view, it represents a significant shift in seller dominance as they push the price higher during the session before eventually selling at the closing price. Alternatively, some traders interpret this pattern as a sign that buyers are reluctant to enter the market due to potential resistance levels, resulting in a narrow-bodied doji with a long upper wick.
Use case for Gravestone Doji
The Gravestone Doji is most commonly used as a bearish reversal signal, particularly when it forms at or near resistance levels, previous highs, or during uptrends. Traders may look to place stop-loss orders just above the upper wick’s length to protect potential short positions, with profit targets being established below significant support levels. By observing this pattern alongside other indicators like moving averages and trendlines, traders can increase their confidence in a bearish reversal scenario.
The Gravestone Doji is an essential tool for traders looking to gain a deeper understanding of market sentiment, trends, and potential price movements. As with any technical analysis signal, it’s crucial to be aware of its limitations and not rely solely on this pattern for making investment decisions. Always consider multiple perspectives, confirming signals, and risk management strategies when utilizing the Gravestone Doji in your trading approach.
Identifying a Long-Legged Doji and Its Significance
Long-legged dojis are a type of doji candlestick, characterized by their long upper and lower shadows. They occur when the open, high, and close prices are almost equal, while the upper and lower wicks represent significant trading ranges. Long-legged dojis appear during periods of indecision in the market, where buyers and sellers have a standoff. Consequently, this pattern can signal potential price reversals.
Long-Legged Doji Structure
A long-legged doji has a small body (open and close prices almost identical) with long upper and lower shadows, creating an appearance similar to a cross or an inverted T shape. The size of these shadows represents the range of trading activity during that specific session. The wicks’ length indicates strong buying and selling pressure within the market.
Interpreting Long-Legged Doji Significance
Long-legged dojis represent indecision among market participants, as neither buyers nor sellers can push prices beyond their respective highs or lows. This struggle for control is often a precursor to significant price movements in the opposite direction of the preceding trend.
For instance, a long-legged doji may form during an uptrend when the market participants cannot continue pushing the price upwards. The appearance of this pattern indicates that sellers have entered the market and prevented further advancement. In this scenario, a long-legged doji could signal a potential bearish reversal. Conversely, if it occurs in a downtrend, buyers may be entering the market to reverse the trend, signaling a potential bullish reversal.
A long-legged doji’s significance lies in its ability to indicate a potential trend reversal based on the market sentiment and previous price action. However, as with any technical analysis tool, it should not be used in isolation. Traders often employ other indicators and confirmation signals before making investment decisions based on this pattern.
In summary, long-legged dojis are an essential part of technical analysis tools for identifying potential price reversals during periods of indecision. Their unique appearance – a small body with significant upper and lower shadows – represents the struggle between buyers and sellers in the market and can provide valuable insights into future market movements. By understanding this pattern’s structure, significance, and limitations, traders can enhance their decision-making process, leading to more informed investment strategies.

FAQ: Frequently Asked Questions About Doji and Candlestick Patterns
What is a Doji, exactly?
A Doji is a unique candlestick pattern in which the open and close price of an asset are virtually identical. It is named after the Japanese term for ‘same thing.’ This pattern, represented by a cross or plus sign on a chart, is believed to indicate indecision among market participants. Although it can also signal a potential price reversal, its reliability is debated due to its rarity and the importance of considering other technical indicators before making investment decisions.
What are the three main types of Doji?
- Gravestone Doji: This type of Doji is characterized by long upper and lower shadows with a small or nonexistent body. Its appearance resembles a traditional gravemarker, and it typically signals bearish sentiment.
- Long-Legged Doji: With long upper and lower shadows and a small body, long-legged Doji represent indecision in the marketplace. While they don’t provide definitive information on price direction, their appearance can hint at a potential continuation of an existing trend or a reversal.
- Dragonfly Doji: A rare but powerful reversal pattern, dragonfly Doji exhibit small bodies with long upper and lower shadows. They typically form at the end of uptrends, suggesting bullish sentiment and a potential price reversal to the upside.
What does a Doji tell investors?
A Doji formation signals indecision among market participants, as evidenced by the open and close prices being nearly equal. This could potentially indicate a trend reversal or a continuation of an existing trend, depending on the context of other technical indicators and overall market sentiment. However, it’s important to note that Doji alone do not provide definitive information on future price movements; they should be used in conjunction with other technical analysis tools for accurate interpretation.
What is the difference between a Doji and Spinning Top?
Both Doji and Spinning Tops are candlestick patterns that can signal indecision or potential reversal points, but there are differences between them. While a Doji has an equal open and close price with little to no body, a Spinning Top displays a larger body with a short upper and lower shadow. The presence of a longer body in a Spinning Top indicates more significant price movement during the period, whereas a Doji implies minimal price activity. As always, it’s essential to consider these patterns alongside other technical indicators for comprehensive analysis.
In summary, Dojis are important tools in technical analysis used to interpret market sentiment and potential price movements. While they can provide valuable insights into the dynamics of financial markets, it’s crucial to understand their limitations and use them in conjunction with other analysis techniques for accurate interpretation.
 Next entry · No. 1,105Understanding Dollar Duration: A Key Metric for Institutional Investors and Bond Fund Managers
See also
-
 No. 3,896
05 May 2025
21 min
Understanding the Parabolic SAR Indicator: Identifying Trends and Reversals in Finance
Financial Tools
No. 3,896
05 May 2025
21 min
Understanding the Parabolic SAR Indicator: Identifying Trends and Reversals in Finance
Financial Tools -
 No. 2,723
29 Jan 2025
20 min
Understanding and Using the Know Sure Thing (KST) Indicator for Momentum Trading
Financial Tools
No. 2,723
29 Jan 2025
20 min
Understanding and Using the Know Sure Thing (KST) Indicator for Momentum Trading
Financial Tools -
 No. 2,669
25 Jan 2025
18 min
Understanding the Kairi Relative Index (KRI): A Technical Analysis Tool for Buy and Sell Signals
Financial Tools
No. 2,669
25 Jan 2025
18 min
Understanding the Kairi Relative Index (KRI): A Technical Analysis Tool for Buy and Sell Signals
Financial Tools -
 No. 1,734
29 Oct 2024
18 min
Understanding the Concepts and Application of Gann Fans in Technical Analysis
Financial Tools
No. 1,734
29 Oct 2024
18 min
Understanding the Concepts and Application of Gann Fans in Technical Analysis
Financial Tools -
 No. 461
25 Apr 2024
17 min
Bollinger Bands: Understanding and Utilizing This Technical Analysis Tool in Finance
Financial Tools
No. 461
25 Apr 2024
17 min
Bollinger Bands: Understanding and Utilizing This Technical Analysis Tool in Finance
Financial Tools -
 No. 210
07 Apr 2024
20 min
Understanding the Arms Index (TRIN): An Essential Technical Analysis Tool for Institutional Investors
Financial Tools
No. 210
07 Apr 2024
20 min
Understanding the Arms Index (TRIN): An Essential Technical Analysis Tool for Institutional Investors
Financial Tools