Understanding the Klinger Oscillator: A Powerful Technical Indicator for Trend Identification and Reversal Signals
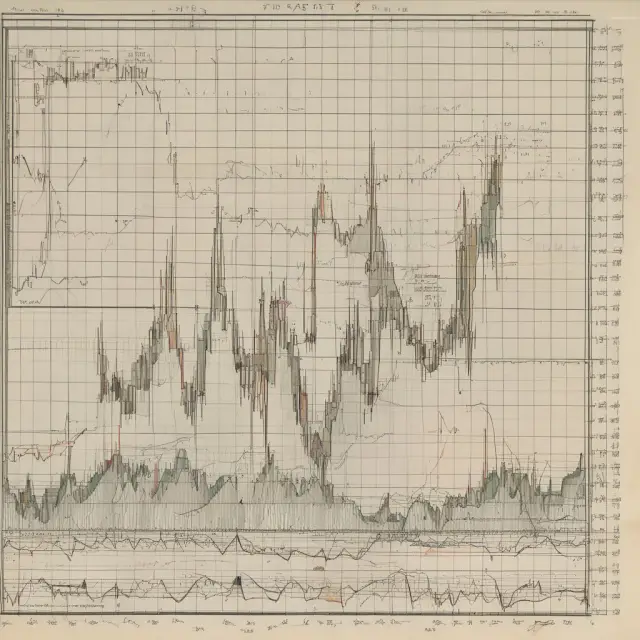
Explore the power of the Klinger Oscillator for trend identification, reversals, and effective trading strategies.
Introduction to the Klinger Oscillator
The Klinger oscillator is an advanced technical indicator designed by Stephen Klinger to offer insights into long-term trend direction and short-term volatility by calculating volume force, which accounts for volume, price trends, and momentum. The indicator compares two exponential moving averages (EMAs) of volume force based on distinct time frames, typically 34 and 55 periods, creating an oscillator that exhibits crossovers and divergences to signal potential buy or sell opportunities.
Klinger Oscillator Definition: This powerful tool is a lagging indicator used for trend identification, reversal confirmation, and determining market strength by evaluating the relationship between price and volume. Its primary goal is to detect changes in the underlying supply and demand dynamics of an asset, offering crucial insights for traders looking to capitalize on short-term trends or longer-term swings.
Origins: The Klinger oscillator was initially developed in 1982 when Stephen Klinger sought to create a momentum indicator that could provide additional context beyond simple price movements. By focusing on volume force and its relationship with price, the Klinger oscillator was born, offering a unique perspective for traders looking for an edge in their technical analysis.
Purpose: The Klinger oscillator is primarily used to identify trend direction, confirm potential reversals through divergence signals, and provide buy/sell opportunities based on crossovers with a signal line. Additionally, this indicator can be employed as part of a broader trading strategy in conjunction with other technical indicators or chart patterns for more accurate market analysis.
Section to be continued:
Calculating the Klinger Oscillator
Interpretations for Price Direction
Understanding Klinger Oscillator and Divergence
Klinger Oscillator vs. On-Balance Volume
Limitations of the Klinger Oscillator
Advanced Klinger Oscillator Trading Strategies
Practical Applications of the Klinger Oscillator
Conclusion: Leveraging the Power of the Klinger Oscillator
FAQs on Klinger Oscillator Trading
Upcoming sections will cover calculating the oscillator, interpreting price direction, understanding divergence, comparing it with On-Balance Volume, discussing limitations, and providing advanced trading strategies along with practical applications. Stay tuned!
Components of the Klinger Oscillator Calculation
The Klinger oscillator, developed by Stephen Klinger, is a powerful technical indicator that provides insights into both short-term and long-term trends while detecting price reversals based on volume flow. It compares volume movement to price actions using an innovative calculation method. In this section, we delve deeper into the calculation process of the Klinger oscillator.
The fundamental components include:
- Volume Force (VF) calculation
- Exponential Moving Average (EMA) calculations for VF
Calculating Volume Force (VF)
To determine the volume force, traders need to calculate a trend factor (T), volume, and volume difference (dm) based on high, low, close prices, and volume from a specific period. The formula is as follows:
Volume Force = V × [2×((dm/cm)−1)]×T×100
Variables in this equation are:
– Trend factor ‘T’: The trend factor determines whether the current period’s high, low, and close prices represent an uptrend (+1) or downtrend (-1). It is determined based on the following condition:
(H+L+C) > (H −1 +L −1 +Cv −1 ) for an uptrend
Else, it’s a downtrend.
– Volume ‘V’: The total volume for the period being analyzed.
– dm: The difference between the current high and low prices (dm = H−L).
– cm: The cumulative moving average (cm) based on previous periods.
If Trend=+1, then cm = dm
Else, cm = dm + dm of the previous period.
Exponential Moving Average (EMA) Calculations for Volume Force
The Klinger oscillator’s calculations involve two EMAs based on volume force: a 34-period EMA and a 55-period EMA. To calculate these EMAs, follow the exponential moving average formula as given below:
EMA = (C × A) + (E × B)
The components in this equation are:
– C: Current period’s volume force value.
– A: Coefficient based on the chosen EMA period (34 or 55), which is calculated as follows: A = 2/(X+1), where X is the moving average period.
– E: Previous period’s EMA value.
– B: The constant term, which is equal to 1−A.
By calculating these two EMAs and observing their difference (KO = 34 Period EMA of VF − 55 Period EMA of VF), traders can use the resulting Klinger oscillator values to determine price direction and potential trend reversals. In the following sections, we will discuss how to interpret these calculations for uptrends, downtrends, and divergence.

Interpretations for Price Direction
The Klinger Oscillator’s primary purpose is to illustrate the relationship between a security’s price direction and volume flow. The indicator’s interpretation depends on whether an asset is in an uptrend, downtrend, or transitioning between both.
Uptrend
When the Klinger oscillator is above its signal line (13-period moving average), it indicates an overall positive trend for the security. A bullish signal is generated when the indicator moves above the signal line following a period of bearishness. Traders can use this as a long entry opportunity, as price movements are typically confirmed by volume. It’s essential to remember that not all crossovers will result in successful trades and should be validated with other technical indicators or chart patterns (such as moving averages and support/resistance levels).
Downtrend
Conversely, when the oscillator moves below its signal line in a downtrend, short-selling opportunities emerge. Traders can place sell orders at the market price once the indicator crosses below the signal line. Like with bullish signals, not every crossover will result in profits and confirmation through additional technical indicators is crucial for maximizing profitability.
Zero Line
The zero line is a significant level that indicates the transition from an uptrend to downtrend or vice versa. When the Klinger oscillator crosses above the zero line, it suggests that buyers are gaining control and a potential long entry opportunity exists. Conversely, when the indicator moves below zero, sellers dominate the market, potentially setting the stage for short positions. As with other indicators, confirming signals through multiple timeframes or chart patterns increases the likelihood of successful trades.
In conclusion, the Klinger oscillator offers valuable insights into volume flow and price direction, enabling traders to make informed decisions about their trades. By understanding the significance of zero lines and crossovers with the signal line, investors can enhance their risk management strategies and potentially increase their profitability. Remember that no indicator is foolproof and that the Klinger oscillator should always be used in conjunction with other technical tools for the most accurate and reliable trading signals.
Understanding Klinger Oscillator and Divergence
The Klinger oscillator is an incredibly powerful technical indicator, providing valuable insights into trend identification, reversal signals, and divergences. This section aims to delve deeper into the concept of bullish and bearish divergences in the context of the Klinger oscillator.
Bullish Divergence
In a bullish divergence, the price trends downwards while the Klinger oscillator moves upwards or starts to form higher highs than previous ones. This discrepancy between the price and the indicator suggests that the downtrend may be weakening and a potential reversal could be imminent.
Bearish Divergence
Conversely, in a bearish divergence, the price trends upwards while the Klinger oscillator moves downwards or starts to form lower lows than previous ones. This situation implies that the uptrend may be losing momentum and could potentially lead to a reversal.
Confirming Signals with Other Indicators
It is important to remember that divergences should not be considered in isolation. A trader must corroborate them with other technical indicators or price action analysis for more confidence in the trade setup. The combination of these signals can help filter out false signals and increase the chances of successful trades.
Example: Bullish Divergence
Consider an example where the price of a particular stock has been trending downwards, while the Klinger oscillator shows higher highs during this downtrend. This bullish divergence could be an early warning sign that the downtrend may soon reverse. In such cases, traders might consider entering long positions when the price starts to rebound or when there is a strong confirmatory signal from other technical indicators, such as moving averages or RSI.
Example: Bearish Divergence
Conversely, if the price of a stock has been trending upwards while the Klinger oscillator shows lower lows during this uptrend, this bearish divergence could indicate that the uptrend is losing momentum and may soon reverse. In such cases, traders might consider entering short positions when the price starts to decline or when there is a strong confirmatory signal from other technical indicators, like moving averages or RSI.
Conclusion: Leveraging the Power of Divergences with Klinger Oscillator
In summary, understanding bullish and bearish divergences in the context of the Klinger oscillator is a crucial aspect of profiting from this powerful technical indicator. By identifying these discrepancies between price and volume data, traders can improve their ability to anticipate potential trend reversals and make more informed trading decisions. Incorporating divergence signals into your strategy, in conjunction with other indicators, can help increase the overall effectiveness of your approach.
As you continue exploring the world of technical analysis and the Klinger oscillator, remember that no single indicator is foolproof or infallible. It’s essential to consider various perspectives and employ multiple tools to validate your trading signals for optimal results. Happy trading!

Klinger Oscillator vs. On-Balance Volume
Two popular volume-based indicators, the Klinger oscillator and On-Balance Volume (OBV), are often compared when it comes to trend identification and reversal signaling. Although they both focus on analyzing volume flows in a financial instrument, their approaches to processing data differ significantly. This section aims to shed light on how these two indicators function and the key differences between them.
The Klinger oscillator was developed by Stephen Klinger as an attempt to measure the relationship between price and volume in determining long-term trend direction while remaining sensitive to short-term price movements. It calculates the difference between two Exponential Moving Averages (EMAs) of Volume Force, which is a function of volume, trend direction, and time. On the other hand, OBV represents a cumulative total of positive and negative volume flows by comparing each day’s closing price with the previous one.
Let us delve deeper into understanding the components and interpretations of both indicators.
Components of Klinger Oscillator Calculation
- Volume Force (VF): VF is calculated based on the trend, volume, and temp. It represents the volume flowing through securities while considering their price direction. The calculation of VF involves determining the difference between current period’s high, low, close prices, and the previous period’s values to determine the trend direction.
- Exponential Moving Averages (EMA): Klinger oscillator calculates two EMAs using the formula provided earlier in this article. The indicator then subtracts the shorter-term moving average from the longer one to obtain the oscillator’s value.
Components of On Balance Volume (OBV) calculation
1. Running Total of Positive and Negative Volume: To calculate OBV, we start with a running total of positive or negative volume based on whether the closing price is higher or lower than the previous day’s close. If the current close is above the prior one, positive volume is added to the total; otherwise, negative volume is subtracted.
Interpretations for Price Direction
Both indicators provide information about the direction of the trend in a financial instrument. For the Klinger oscillator, traders watch for divergences and crossovers above or below the signal line to determine potential buying or selling opportunities. In contrast, On-Balance Volume generates signals by looking at the total net flow of volume and its relationship with price direction.
Investors can use both indicators together for a more comprehensive analysis of market trends and reversals. The following sections discuss various advanced trading strategies and practical applications of these indicators.
Stay tuned for further insights into Klinger oscillator strategies, including combining it with other indicators, using multiple timeframes, and employing practical examples to enhance your understanding and expertise in trend identification and reversal trading.

Limitations of the Klinger Oscillator
While the Klinger oscillator provides valuable insights into price direction and trend identification, it’s not without its limitations. Two primary challenges that traders face when using this indicator are false signals from crossovers, inconsistencies with zero line crossings, and issues related to divergence.
False signals from Crossovers
One limitation of the Klinger oscillator lies within its numerous crossover signals. As a result of the two exponential moving averages used in the oscillator’s calculation, frequent crossovers are common. Filtering out which crossovers are worth acting upon can be challenging, as false signals may lead to missed opportunities or unnecessary trades.
Inconsistencies with zero line crossings:
Another potential problem lies within the zero line crossings of the Klinger oscillator. The transition from an uptrend to a downtrend, and vice versa, is determined by the crossing of this line. However, the indicator can criss-cross the zero line multiple times before moving in a sustained direction or fail to move with the price altogether, potentially resulting in missed trading opportunities.
Issues related to divergence:
The use of divergence as a tool for identifying potential reversals and trend changes is another limitation of the Klinger oscillator. While it can be an effective method for confirming a price reversal when both the indicator and the price move in opposite directions, divergence is not present at all price reversals. Furthermore, divergence may occur too early, causing traders to miss significant parts of the trend or the divergence failing to result in a confirmed price reversal.
To mitigate these issues, it’s essential to use the Klinger oscillator in conjunction with other technical indicators and price action analysis for increased accuracy and reliability. By combining this powerful tool with various trading methods, traders can enhance their overall trading strategy and make more informed decisions based on multiple confirmations rather than relying solely on one indicator’s signals.
In the following sections, we’ll explore advanced Klinger oscillator trading strategies, as well as practical applications of the indicator to help traders better understand its potential and limitations in the ever-evolving financial markets.

Advanced Klinger Oscillator Trading Strategies
The Klinger oscillator, developed by Stephen Klinger, offers a unique perspective on the interplay between volume and price movements to identify trend directions and potential reversals. Building upon the foundation laid out in our previous discussion of the Klinger oscillator’s calculations and interpretations, let’s delve deeper into advanced strategies traders can employ with this powerful technical indicator.
Firstly, combining the Klinger oscillator with other indicators or chart patterns can significantly enhance its effectiveness in pinpointing profitable trades. For example, the Relative Strength Index (RSI) and Moving Average Convergence Divergence (MACD) are popular tools that, when used together with the Klinger oscillator, can provide stronger confirmation signals.
To illustrate this point, consider a bullish divergence scenario: as prices start to decline, the RSI may display an oversold condition, while the Klinger oscillator continues to rise. This divergence serves as a strong indication that a price reversal might be imminent. By combining these two signals, traders can confidently enter long positions at or near the point of divergence, knowing that both indicators are suggesting a potential trend reversal.
Another advanced strategy is utilizing multiple timeframes. This approach involves examining various timeframes to gain a more comprehensive understanding of the market conditions and confirming trends and reversals across different chart scales. For instance, traders might first analyze daily or weekly charts for broader trends, then shift their focus to intraday or hourly charts for identifying entry and exit points.
Applying this strategy in practice could look like the following scenario: as a trader notices a bullish divergence on an intraday chart, they would first confirm this signal by checking if a bearish trend is present on the daily chart. If both the daily and intraday charts indicate bullish divergences, this setup significantly increases the chances of a successful trade.
By employing advanced strategies such as these, traders can leverage the Klinger oscillator’s unique insights into volume and price dynamics to maximize profit opportunities while minimizing risk.

Practical Applications of the Klinger Oscillator
The Klinger oscillator’s unique approach to analyzing both volume and price provides traders with valuable insights into trend direction and potential reversals. Let us explore some real-world examples of how traders effectively employ this powerful technical indicator in their strategies.
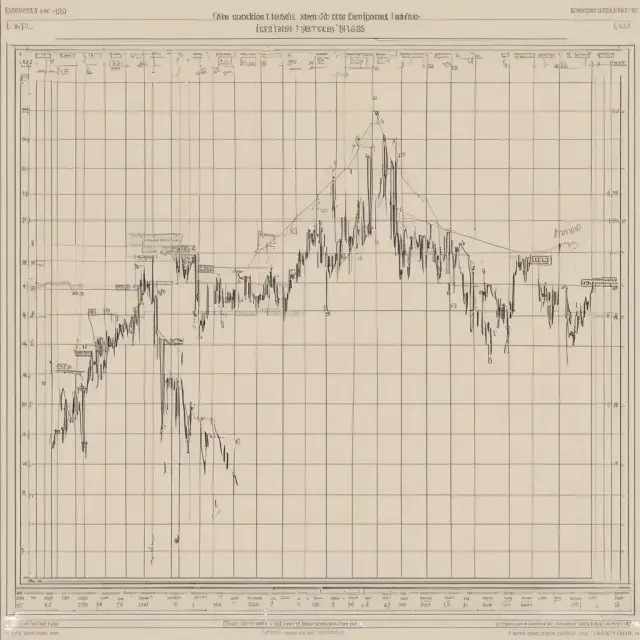
A classic use case for the Klinger oscillator is identifying bullish or bearish divergence between the indicator’s values and the price action of an asset. In a bullish divergence scenario, as illustrated in Figure 1, while prices may be trending downward, the Klinger oscillator’s values could be increasing, signaling potential reversal. This discrepancy can lead to profitable long positions when the oscillator crosses back above its signal line or makes a higher high.
Figure 1: Bullish Divergence Example
Another practical application of the Klinger oscillator lies in its ability to confirm trend directions using moving averages and trendlines. In uptrends, as shown in Figure 2, a stock may experience periods of declining volume, causing the Klinger oscillator’s values to fall below zero. However, when the indicator eventually moves above zero once again, it confirms that the underlying trend remains upwards, providing traders with an opportunity to buy or add positions.
Figure 2: Uptrend Confirmation
Traders may also use multiple timeframes in conjunction with the Klinger oscillator to identify more robust signals and increase the accuracy of their trades. For instance, by observing the indicator’s behavior across different timeframes, such as a daily chart versus a 1-hour chart, traders can gain a better understanding of the strength of an emerging trend or reversal signal.
Advanced strategies include combining the Klinger oscillator with other indicators and chart patterns to confirm trade signals. For example, a bullish crossover between the oscillator’s moving averages (34-period EMA and 55-period EMA) in conjunction with a golden cross on the relative strength index (RSI) may generate an especially strong buy signal.
Figure 3: Advanced Klinger Oscillator Strategy
In conclusion, the Klinger oscillator’s practical applications offer traders a unique perspective on price and volume relationships, enabling them to make informed decisions regarding trend direction, potential reversals, and entry/exit points. By incorporating this indicator into their technical analysis toolbox alongside other indicators and chart patterns, traders can significantly enhance their ability to navigate financial markets with confidence.

Conclusion: Leveraging the Power of the Klinger Oscillator
In conclusion, the Klinger oscillator offers a unique perspective on the market dynamics by incorporating volume and trend into its calculations to determine long-term and short-term price direction. As discussed previously, this indicator’s primary functions include identifying price divergences and analyzing crossovers using a signal line.
The Klinger oscillator differs from other indicators such as On Balance Volume due to its calculation of volume force (VF) and application of exponential moving averages (EMA). This difference allows traders to gain insights into how the volume flow impacts price movements, offering additional confirmation for potential trade signals.
However, it is essential to understand that no indicator is infallible. The Klinger oscillator may generate false signals due to its sensitivity to divergence and crossovers. Traders are encouraged to employ other indicators, such as moving averages or trendlines, to validate potential trades generated by the Klinger oscillator.
In practice, the Klinger oscillator has proven itself a valuable tool for traders seeking an edge in their trading strategies. It can be used in conjunction with various chart patterns and other indicators to increase accuracy and confirm price reversals or continuation signals. To effectively utilize this indicator, consider the following guidelines:
- Familiarize yourself with the concept of volume force and its importance in determining trend direction.
- Practice calculating the Klinger oscillator manually or by using a reliable trading platform.
- Understand the significance of crossovers and divergences in relation to price movements and trend direction.
- Combine the Klinger oscillator with other indicators and chart patterns for increased confirmation and accuracy.
- Employ proper risk management techniques and consider market conditions before implementing trades based on Klinger oscillator signals.
For further learning resources, we recommend the following materials:
- “Technical Analysis From a Different Perspective” by Stephen P. Klinger
- Online trading courses focused on advanced indicators and volume analysis
- Trading platforms offering customizable charting tools and access to the Klinger oscillator indicator
- Financial blogs and forums specializing in technical analysis and indicator use
By integrating the knowledge gained from this article with practical application, you will be well-equipped to harness the power of the Klinger oscillator as an essential component of your trading strategy.

FAQs on Klinger Oscillator Trading
The Klinger oscillator is an advanced and powerful technical indicator for determining trend identification and reversal signals in the financial markets. Developed by Stephen Klinger, this indicator calculates the difference between two moving averages based on volume force (VF), providing insight into the relationship between price movements and the underlying volume dynamics. In this section, we’ll address some frequently asked questions related to using the Klinger oscillator for successful trading strategies.
What is the difference between the Klinger oscillator and other trend-following indicators?
Unlike simple moving averages (SMAs) or Bollinger Bands, the Klinger oscillator doesn’t directly measure the price trend itself but instead focuses on the relationship between volume flow and price movements. It is particularly useful for traders who want to analyze the market using a combination of both price and volume data.
How do I interpret the Klinger oscillator signal line?
The 13-period moving average, also known as the signal line, serves as a reference point for potential buy or sell signals. Traders may consider entering long positions when the Klinger oscillator moves above its signal line from below and short positions when it moves below from above. These crossovers provide an additional confirmation of trend reversals.
How does the Klinger oscillator’s zero line function?
The zero line, which represents the equilibrium point between the two EMAs, is often used to identify potential transition points in the market. When the indicator crosses above or below the zero line, traders may take it as a sign of changing market conditions and consider adjusting their positions accordingly.
How can I use divergence with the Klinger oscillator?
Bullish and bearish divergences occur when there is a difference between the price action and the Klinger oscillator’s movements. A bullish divergence signals that the indicator may be signaling an imminent reversal while the price continues to trend in the opposite direction, whereas a bearish divergence indicates that the price may continue its downtrend despite the indicator’s bullish signal.
What are some limitations of the Klinger oscillator?
While the Klinger oscillator can provide valuable insights into market trends and reversals, it is essential to acknowledge its limitations. False signals from crossovers, inconsistencies with zero line crossings, and potential issues with divergence can make it challenging for traders to rely solely on this indicator for making trading decisions. It’s always recommended to use the Klinger oscillator in conjunction with other indicators and technical analysis tools for a more comprehensive perspective on market conditions.
Are there any advanced strategies that utilize the Klinger oscillator?
Absolutely! Experienced traders can combine the Klinger oscillator with other indicators, such as moving averages or chart patterns, to enhance the effectiveness of their trading signals. Additionally, using multiple timeframes for analysis and following a disciplined approach to risk management are crucial components of successful Klinger oscillator strategies.
In summary, the Klinger oscillator is a valuable tool for traders seeking insights into market trends and reversals by analyzing price movements and volume dynamics. By understanding its unique features and capabilities, as well as being aware of potential limitations, traders can effectively utilize this indicator to enhance their overall trading strategy.
 Next entry · No. 2,719Understanding the Kuala Lumpur Stock Exchange (KLSE) and its Role in Malaysian Capital Markets
See also
-
 No. 2,899
12 Feb 2025
19 min
Understanding Linearly Weighted Moving Average (LWMA): Definition, Calculation, and Significance
Financial Data Analysis
No. 2,899
12 Feb 2025
19 min
Understanding Linearly Weighted Moving Average (LWMA): Definition, Calculation, and Significance
Financial Data Analysis -
 No. 4,188
29 May 2025
20 min
Understanding the QStick Indicator: A Technical Analysis Tool for Trend Identification
Market Trends
No. 4,188
29 May 2025
20 min
Understanding the QStick Indicator: A Technical Analysis Tool for Trend Identification
Market Trends -
 No. 3,035
23 Feb 2025
21 min
Understanding Moving Average Convergence/Divergence (MACD) in Finance and Investment
Financial Tools
No. 3,035
23 Feb 2025
21 min
Understanding Moving Average Convergence/Divergence (MACD) in Finance and Investment
Financial Tools -
 No. 4,065
19 May 2025
20 min
Price Rate of Change (ROC) Indicator: Understanding Momentum in Finance
Financial Education
No. 4,065
19 May 2025
20 min
Price Rate of Change (ROC) Indicator: Understanding Momentum in Finance
Financial Education -
 No. 3,288
16 Mar 2025
21 min
Understanding Moving Averages in Finance: Simple vs Exponential
Business Finance
No. 3,288
16 Mar 2025
21 min
Understanding Moving Averages in Finance: Simple vs Exponential
Business Finance -
 No. 3,020
22 Feb 2025
22 min
Understanding Low Volume Pullbacks in Finance and Investment
Business Finance
No. 3,020
22 Feb 2025
22 min
Understanding Low Volume Pullbacks in Finance and Investment
Business Finance