Descending Triangle: Understanding This Bearish Chart Pattern and Its Trading Implications

Understand the bearish Descending Triangle chart pattern and trading implications through its features, identification, strategy, and usage with Heikin-Ashi…
Introduction to Descending Triangles in Technical Analysis
A descending triangle is a chart pattern that plays a significant role in technical analysis, helping traders gauge potential price movements and trends. This pattern forms when an asset’s prices display a consistent downtrend and exhibits a specific trendline formation consisting of lower highs and horizontal support levels. The descending triangle can act as both a continuation pattern for a bearish trend or a bullish reversal pattern, providing valuable insights to traders looking to make informed decisions on their investments.
Characteristics of a Descending Triangle:
Before the appearance of a descending triangle, there must be an established downtrend in place. A descending triangle is drawn by connecting the upper points with one trend line that slopes downward, while another horizontal trendline connects the lower prices, acting as potential support until the pattern breaks out.
Identifying a Descending Triangle:
Spotting a descending triangle can provide valuable insights into a potential price movement or trend reversal. Once traders identify this pattern, they can make informed decisions on entering short positions or waiting for bullish reversals. The significance of a descending triangle lies in its ability to show weakening demand and the possibility of a downward momentum shift.
Trading a Descending Triangle:
When it comes to trading a descending triangle, traders can take advantage of the short position setup following a breakdown from lower trendline support. A profitable opportunity arises when the price targets are calculated as the entry price minus the vertical height between the two trend lines at the time of the breakdown. The upper trend line resistance also acts as a stop-loss level to limit potential losses for traders.
Descending Triangle Breakout Strategy:
A breakout strategy can be used to anticipate descending triangle breakouts by combining volume analysis and following the overall trend direction. Traders closely monitor lower highs and higher lows, waiting for a bullish reversal or a breakdown in the price action that confirms their entry points.
Descending Triangles with Heikin-Ashi Charts:
Heikin Ashi charts, a popular tool among traders, can be used in conjunction with descending triangles to anticipate bullish reversals more effectively. As the descending triangle forms and price action stalls at the lower trendline support level, Heikin Ashi charts may reveal a bullish trend reversal before a breakout occurs.
Descending Triangle Breakdown:
A descending triangle breakdown indicates that downward momentum is likely to continue. Traders can enter into short positions following confirmation of price movement below the lower horizontal support level. Profit targets are typically calculated using the same method as described earlier, with the difference being that traders aim for potential losses instead of gains.
Descending Triangle vs. Ascending Triangle:
Although both descending and ascending triangles share some similarities, they differ significantly in their overall meaning and implications for traders. While a descending triangle is a bearish pattern, an ascending triangle acts as a bullish continuation or reversal pattern. Each triangle pattern presents unique opportunities for investors depending on market conditions.
Conclusion:
Understanding the intricacies of descending triangles in technical analysis can significantly contribute to a trader’s success in making informed investment decisions. This powerful chart pattern provides insights into potential price movements, trends, and reversals, helping traders anticipate short-term profits and minimize losses. By mastering the ability to identify descending triangles and their accompanying strategies, traders are better equipped to navigate market volatility and adapt to ever-changing financial landscapes.

Key Features of a Descending Triangle
A descending triangle is an intriguing chart pattern that helps traders understand potential price movements by providing information about the market’s trend and potential shifts. A descending triangle is formed when there is a clear downtrend before the formation of the triangle, with sellers pushing prices downward. The pattern consists of two trendlines: one ascending for highs (upper trendline) and another horizontal for lows (lower trendline).
The upper trendline in a descending triangle connects a series of lower highs, while the lower trendline is a support level formed by connecting a series of lows. As the price approaches this lower trendline support, it often creates a sense of false security among bullish traders. However, once the lower trendline is breached, it’s a clear indication that downward momentum is likely to continue.
Traders will often monitor volume levels during this stage as a high-volume breakdown can provide additional confirmation that a bearish reversal might be at hand. Once the breakout occurs and the price drops below the lower trendline, a short position setup can be entered for those looking to profit from a further decline in price. The vertical height between the two trendlines at the time of the breakdown provides an approximate profit target for traders.
It is essential to note that after a descending triangle pattern’s breakout, the price continues to move downwards below the lower trendline, solidifying the bearish momentum. By understanding these key features, traders can effectively monitor and capitalize on potential opportunities presented by descending triangles in their investment strategies.
In conclusion, this section focuses on the essential aspects of a descending triangle, including its formation, significance, and implications for traders. This knowledge serves as a foundation for further exploration into various trading techniques and strategies associated with this powerful chart pattern. In the next sections, we will discuss how to identify a descending triangle and develop an effective trading strategy to take advantage of its bearish potential.
[End of Section]

Identifying a Descending Triangle
A descending triangle is one of the most popular bearish chart patterns used by traders. This technical analysis tool helps predict that downward momentum is likely to continue once price breaks below the lower support trend line. In this section, we will discuss how to identify a descending triangle and its importance as a potential entry point for short positions.
Components of a Descending Triangle
Before identifying a descending triangle, it’s essential to recognize that the pattern forms within an established downtrend. A descending triangle is formed by connecting the upper points with one trend line (descending upper trendline) and the lower points with another (lower horizontal trendline). The upper trendline represents sellers pushing prices downward, while the lower horizontal support line acts as a potential entry point for traders looking to capitalize on further price declines.
Lower Support Trendline and Entry Point
Once a descending triangle appears, traders often watch closely for a breakdown from the lower support level. A high volume break below the lower support trendline is a strong signal that downward momentum is building and a breakdown is imminent. After this breakout, prices will continue to decline, making it an excellent opportunity for short positions.
To maximize profits, traders can set their profit target equal to the entry price minus the vertical height between the two trend lines at the time of the breakdown. Additionally, using the upper trendline as a stop-loss level can help limit potential losses. This simple yet effective strategy makes it one of many popular ways to utilize descending triangles in trading.
In conclusion, identifying a descending triangle involves recognizing an established downtrend, connecting highs with a descending upper trendline and lows with a lower horizontal support line. As prices approach the lower support trendline, a potential breakout can provide traders with valuable opportunities to profit from further downward price movements.
How to Trade Descending Triangles
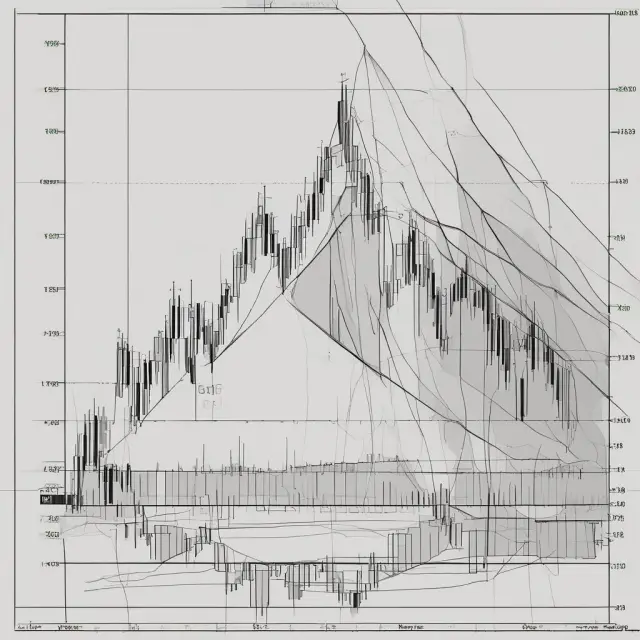
A descending triangle is a technical analysis pattern that forms when there is an existing downtrend beforehand, and sellers push the price downward by creating lower highs while buyers try to defend the market at the support levels, resulting in lower lows. Traders often enter into short positions following a breakdown from the lower trend line support to accelerate a further decline. In this section, we will discuss how to trade a descending triangle and set up profit targets and stop-loss levels based on its unique characteristics.
Understanding Descending Triangle Entry Points:
When entering into short positions with descending triangles, it’s essential to identify the right entry point. The ideal entrance comes when price action breaks below the lower support trend line, indicating a breakdown and downward momentum. To calculate your entry price for shorting the market, you can use the following steps:
- Identify the existing downtrend before the triangle pattern appears.
- Draw a descending upper trendline by connecting the high points, which show sellers pushing prices lower.
- Connect the low points to create a horizontal lower support trend line.
- Wait for the price to break down below the lower support trend line and enter into a short position when this occurs.
- Use the height from the highest high point (point A) to the lowest low point (point B) as your profit target calculation, which can be determined by subtracting the difference between these two points (point A minus point B) from the entry price. For example: If the highest high is $100 and the lowest low is $90, then the potential profit target would be $10 ($100-$90).
- Set your stop-loss level just above the upper trendline resistance to limit your potential losses.
Calculating Profit Targets and Setting Stop Losses:
Profit targets are essential for setting objectives in your trading strategy, while stop losses help protect your investments from significant drawdowns. In the context of descending triangles, profit targets are calculated by using the difference between the highest high (point A) and lowest low (point B) in the triangle pattern to determine potential gains.
Stop-loss levels should be set above the upper trendline resistance, which acts as a support level for the downtrend before the triangle forms. This level can serve as your stop loss, limiting potential losses if the price breaks back up into the triangle.
In conclusion, descending triangles provide an opportunity to enter short positions following a breakdown from lower trend line support and set up profit targets and stop-loss levels accordingly. By understanding the unique characteristics of this technical analysis pattern and implementing a well-planned trading strategy, traders can potentially capitalize on its downward momentum while minimizing risk.

Descending Triangle Breakout Strategy
The descending triangle breakout strategy involves anticipating a price movement by observing a combination of volume and trend in this bearish chart pattern. As a descending triangle signals that demand for an asset is weakening, the breakdown from the lower support trend line presents an opportunity to make short-term profits.
To execute this strategy, traders closely monitor the price action during the consolidation phase of a downtrend. They look out for lower highs and lower lows within the triangle formation while keeping track of volume trends. A descending triangle pattern is confirmed when the price breaks below the lower support trend line with increased trading volumes.
After the breakdown, the next step is to set a profit target based on the vertical height between the two trend lines at the time of the breakout. For instance, if the height from the upper trend line to the lower trend line is $10, traders may anticipate a potential profit of $10 per share.
The upper trend line resistance can also serve as a stop-loss level for traders to limit their potential losses. In case the price rebounds and moves above the upper trend line resistance, they may choose to close their position or adjust it accordingly based on market conditions.
When employing the descending triangle breakout strategy, patience is crucial. Traders must wait for the clear confirmation of a breakdown before entering into short positions. Rushing into trades prematurely can lead to missed opportunities or unnecessary losses.
It’s important to remember that no chart pattern guarantees a profitable trade, and there may be false breakdowns. In such cases, traders should re-evaluate the trend lines and reassess market conditions before making any decisions. Additionally, they must stay updated on economic news, company fundamentals, and other factors influencing the underlying asset to make informed trading decisions.
Descending Triangles with Heikin-Ashi Charts
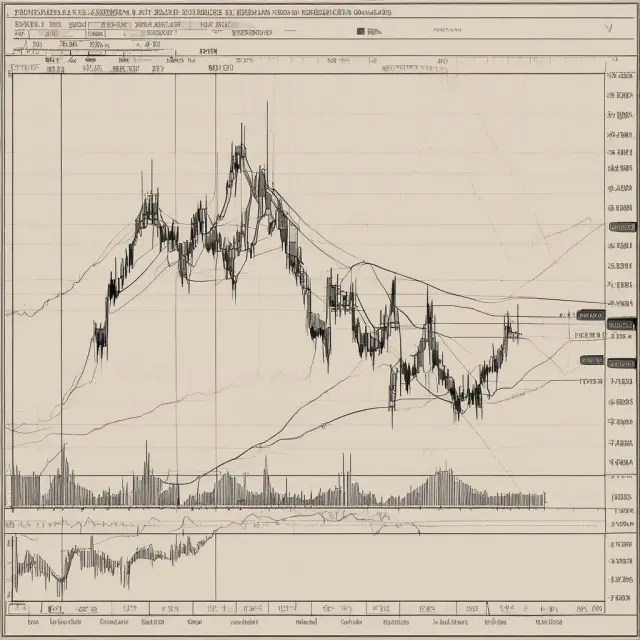
Heikin-Ashi charts are an alternative way to view market data, popular among technical traders for their simplicity and accuracy in capturing the overall trend direction. The charts provide a smoothed representation of price action by averaging out the opening, closing, highest, lowest, and midpoint prices each candle stick period.
When it comes to identifying chart patterns like descending triangles, Heikin Ashi charts can offer valuable insights. A bullish reversal in a descending triangle pattern is often hinted at through the Heikin Ashi candlesticks before the actual breakout occurs. Traders looking to take advantage of this strategy can watch for a descending triangle forming and wait for the Heikin Ashi chart to indicate an upward trend reversal.
To use this method, traders must first identify a descending triangle pattern on their regular price charts. Once they have done that, they should switch over to a Heikin Ashi chart with the same time frame and observe how the candlesticks evolve. A bullish trend reversal in a descending triangle is often signaled by:
- Long white candles (bullish) appearing after a series of long black candles (bearish).
- The appearance of a doji or hammer candlestick, indicating potential price reversals.
- Bullish engulfing patterns where larger bullish candles absorb and encompass previous bearish ones.
When the Heikin Ashi chart displays these signals, traders can confidently enter long positions based on the anticipated breakout of the descending triangle pattern. However, it is essential to ensure that the breakout is confirmed by price action on regular price charts to avoid false signals.
In summary, combining descending triangles with Heikin Ashi charts offers an effective strategy for identifying bullish reversals in a bearish trend, maximizing profits through short-term trades while minimizing risk. By watching for the emergence of bullish trends on Heikin Ashi charts before the actual breakout occurs, traders can gain a competitive edge and secure potential gains when other strategies may still be uncertain or hesitant to enter positions.

Descending Triangle with Moving Averages
When examining price movements using technical analysis tools, one should not overlook moving averages and their role within descending triangles. Descending triangles are an intriguing chart pattern that can signal a bearish trend or the potential reversal of a downtrend. Let’s explore how moving averages interact with descending triangle patterns and offer insight into price trends.
Moving Averages: An Overview
Moving averages (MAs) are simple mathematical tools used to analyze trends in financial markets by calculating the average value of an asset over a predefined time frame. When charting moving averages, the most common settings include 50-day, 100-day, and 200-day moving averages. These lines represent historical price data points that can help traders establish trends and identify potential support and resistance levels.
Interpreting Moving Averages in Descending Triangles
Descending triangles typically signal a bearish trend, making them an interesting combination with moving averages to anticipate potential breakouts. When the descending triangle pattern emerges within a downtrend, it may indicate that the asset is undergoing consolidation before continuing its downward trajectory. In this scenario, short sellers look for a breakdown below the lower support line or trendline, which may trigger a move toward their desired profit target.
Identifying Moving Averages Within Descending Triangles
To identify moving averages within descending triangles, traders must first establish an existing downtrend and observe as prices create lower highs and higher lows to form the triangle’s upper and lower trendlines. The moving average lines are then plotted based on historical price data points. In a bearish trend, these moving averages will be sloping downward.
Using Moving Averages to Anticipate Descending Triangle Breakouts
To anticipate descending triangle breakouts, traders can watch for specific patterns in the moving average lines as they interact with the upper and lower trendlines. A breakdown below the lower support line may coincide with a crossover between the short-term and long-term moving averages, providing an added confirmation signal for a bearish move. By combining this information with price action analysis, traders can make informed decisions on entering short positions and setting stop losses.
In summary, moving averages play a crucial role in understanding descending triangles by helping to confirm trends and identify potential breakout points. By observing the interactions between these technical indicators, traders can potentially capitalize on market volatility and profit from short selling opportunities within descending triangle patterns.

Descending Triangle Reversal Pattern: Top
A descending triangle is typically regarded as a bearish continuation chart pattern or a signal for an imminent breakdown when observed during a downtrend. However, it can also act as a bullish reversal pattern in certain circumstances. In this section, we’ll focus on the bullish interpretation of the descending triangle and its key features when acting as a reversal pattern at the top end of a downtrend.
First, let us briefly discuss the standard descending triangle pattern. The formation of a descending triangle commences with an existing downtrend before the pattern emerges. As sellers continue to push prices downwards, they create lower highs while prices continue to touch and bounce off a horizontal support level. This support level acts as potential resistance upon reversal.
The pattern’s defining characteristic is the presence of two distinct trendlines. A descending upper trendline can be drawn by connecting the upper points in the pattern. This trendline indicates that sellers are exerting their dominance over buyers, pushing prices lower. The second horizontal trendline forms by connecting a series of lower swing lows, acting as a potential support level until a breakout occurs.
When the price breaks above the descending upper trendline, it suggests that buying pressure has intensified and that bullish momentum could potentially take over. This is when traders consider entering long positions in anticipation of an uptrend following the reversal. The profit target for this setup would be equal to the height of the triangle (measured from the low point at the base to the high point just before the breakout), added to the entry price.
Identifying a bullish descending triangle reversal pattern can provide traders with excellent opportunities to take advantage of potential market movements. In the next section, we’ll discuss how to spot this pattern on charts and what steps to follow when considering opening long positions.

Descending Triangle Reversal Pattern: Bottom
A Descending Triangle is typically considered a bearish chart pattern indicating weakening demand for an asset. However, this trend can be flipped when the triangle reaches its bottom end, revealing a bullish reversal. In such instances, a descending triangle reversal pattern occurs.
Identifying a Bullish Reversal
To identify a descending triangle reversal pattern, you must first recognize the downtrend and the established support levels. A descending triangle’s lower trend line acts as resistance in this case, indicating that buyers are entering the market, increasing demand. When prices break above the lower trendline, it is considered a bullish reversal.
Making Long Positions
Traders who anticipate a bullish reversal can enter long positions when prices break through the lower trend line resistance. This move suggests that upward momentum is gaining strength and may continue to grow. As with all trading strategies, stop-loss orders should be placed at appropriate levels to manage risk effectively.
A bullish descending triangle reversal pattern offers a clear entry point for traders seeking a change in market direction. By carefully watching chart patterns and recognizing the potential for a reversal, traders can capitalize on this opportunity and potentially secure substantial profits.
Understanding the Differences
It’s essential to remember that descending triangles have both bullish and bearish implications depending on the context in which they appear. A regular descending triangle is considered bearish and is characterized by a downtrend preceding the pattern with lower highs and horizontal lows forming an ascending triangle-like appearance. Conversely, a bullish reversal descending triangle occurs when buyers enter the market in large quantities to push prices above the lower trend line resistance.
The Importance of Volume
Volume plays a significant role in recognizing a bullish reversal within a descending triangle pattern. An increase in trading volume is often seen at the point of the breakout, indicating strong buying pressure from traders. A consistent surge in trading volume further validates the reversal and increases the likelihood that an uptrend will follow.
In summary, while descending triangles are typically viewed as bearish chart patterns, a bullish reversal can occur at the end of a downtrend. By identifying the key features of a descending triangle reversal pattern, such as a break above the lower trendline resistance and an increase in trading volume, traders can make informed decisions to enter long positions and profit from this market event.

Descending Triangles vs. Ascending Triangles
Triangles are among the most popular continuation patterns used by technical analysts, and they reveal an opportunity to short or long based on their specific structure. While both ascending and descending triangles share some similarities as continuation patterns, there are significant differences between them in terms of their features and implications.
Descending Triangle: A Bearish Continuation Pattern
A descending triangle is a bearish chart pattern that emerges when prices form lower highs and higher lows during a downtrend. The two essential trend lines for a descending triangle are the upper trend line, which connects the swing points of the descending highs, and the lower horizontal trend line, which connects the swing points of the ascending lows.
In a bearish continuation pattern, the descending triangle signals traders to take a short position to accelerate a breakdown once the price breaks below the lower support level. The breakout is often confirmed with a strong volume surge, indicating that the selling pressure has significantly increased and the downtrend is likely to continue.
The descending triangle’s significance lies in its ability to illustrate weakening demand as the price fails to make new highs despite lower lows being formed. In essence, the pattern indicates that sellers are gaining momentum, increasing the likelihood of a significant downward trend move after the breakdown.
Ascending Triangle: A Bullish Continuation Pattern
An ascending triangle is its counterpart and appears as an inverted version of the descending triangle pattern. It emerges when prices form higher lows and lower highs during an uptrend. In a bullish continuation pattern, the upper horizontal trend line connects the swing points of the lower highs, while the lower support trend line links the swing points of the higher lows.
When prices break above the upper resistance level in an ascending triangle pattern, it indicates that buyers are gaining momentum and pushing the price upwards. The bullish continuation is confirmed with a strong volume surge, indicating that the uptrend will likely persist after the breakout.
The significance of an ascending triangle lies in its ability to illustrate strengthening demand as prices fail to make new lows despite higher highs being formed. In essence, the pattern indicates that buyers are gaining momentum, increasing the likelihood of a significant upward trend move after the breakout.
Key Differences between Descending and Ascending Triangles
The primary differences between descending triangles and ascending triangles lie in their directionality and implications for traders. While both patterns serve as continuation patterns during an existing downtrend or uptrend, respectively, they offer contrasting signals for entry and exit points based on the breakout direction.
Additionally, understanding these chart patterns requires a solid grasp of trend lines, support levels, and resistance levels to maximize profitability. For traders looking to capitalize on either pattern, it is crucial to remain disciplined and patient while following established trading rules and risk management strategies.

Limitations and Considerations for Descending Triangles
Descending triangles offer valuable insights into market trends but are not foolproof indicators of price movement. Understanding their limitations and potential shortcomings is essential to make informed trading decisions and maximize profits. Two common limitations include false breakdowns and the need to redraw trend lines.
False Breakdowns
A false breakdown occurs when the price breaks below the lower support trend line but then reverses direction, forming a bullish reversal pattern instead of confirming the downtrend continuation. Inaccurately interpreting this situation could lead traders into entering short positions too early, potentially causing losses and missed opportunities for profits. A false breakdown is more likely to occur when market volatility increases or when there are significant news events that influence price action. To minimize the risk of false breakdowns, it’s crucial to combine descending triangles with other indicators and confirmation signals before making any trading decisions.
Redrawing Trend Lines
Trend lines act as essential tools in identifying the support and resistance levels of a security’s price movement. However, market conditions change over time, leading to a need to redraw trend lines. If the price action breaks out above or below the existing trend lines, it is necessary to adjust them accordingly. Failure to do so could lead traders into entering trades based on outdated information, potentially resulting in losses.
The Importance of Price Confirmation and Reliability
When using descending triangles as a trading signal, it’s essential to ensure that the price confirms the anticipated trend continuation or reversal. A breakdown or breakout should be accompanied by increased trading volume to confirm market sentiment and enhance the reliability of the pattern. Additionally, traders should consider other indicators and analysis methods, such as moving averages and oscillators, to validate the descending triangle signal. This multi-faceted approach helps mitigate the risk of false signals and maximizes the potential for profits.
In conclusion, while descending triangles provide valuable insights into market trends, they are not foolproof indicators. Understanding their limitations, such as false breakdowns and the need to redraw trend lines, is crucial to make informed trading decisions and minimize losses. By combining descending triangles with other indicators and analysis methods, traders can maximize profits and improve the overall effectiveness of their investment strategies.

FAQs: Descending Triangle Breakout
A descending triangle is a popular chart pattern in technical analysis, which appears when one trend line is drawn connecting successively lower highs and another trend line is drawn horizontally across the same price level, connecting successive lows. When it comes to interpreting this bearish continuation pattern, traders often have various questions. In this section, we will address some common queries regarding descending triangle breakouts.
What’s the difference between a descending triangle breakdown and a descending triangle breakout?
A descending triangle breakdown refers to a situation where the lower support line of the descending triangle is breached, which indicates a continuation of the downtrend. A descending triangle breakout, on the other hand, occurs when the upper resistance line is broken, signaling a possible reversal and a shift in market sentiment from bearish to bullish.
How can one recognize a descending triangle pattern?
To identify a descending triangle pattern, you should look for an existing downtrend before it appears. The pattern consists of a series of lower highs and the same level of support on the lows. Be sure that there is enough price action to define clear trend lines, as this will help ensure a reliable breakout when it occurs.
What’s the significance of the descending triangle in technical analysis?
The descending triangle pattern represents a potential breakdown in price action for an asset or security. When the lower support line of this chart pattern is breached, it indicates that sellers have regained control, and the downtrend may continue. In contrast, a bullish interpretation would take place if the upper resistance line were broken, leading to a reversal in market sentiment.
What are some techniques for trading the descending triangle breakout?
When entering short positions based on a descending triangle breakdown, traders often set their profit targets at a price equal to the vertical height between the upper and lower trend lines before the breakdown. The stop-loss level can be placed just above the upper trend line resistance as an additional precaution. On the other hand, when trading long positions following a breakout from the upper resistance line, traders may consider using a profit target equal to the price difference between the entry and the point of the breakout.
How do descending triangles relate to other chart patterns like falling wedges?
While both descending triangles and falling wedges are continuation patterns, they have distinct differences in interpretation. Descending triangles are typically considered bearish due to their downtrend before the formation of the pattern, while falling wedges may indicate a bullish reversal as they appear at the end of a downtrend. In both cases, however, these chart patterns can reveal opportunities for profitable trades based on price movements.
 Next entry · No. 1,016Understanding Descriptive Statistics: Measures of Central Tendency, Variability, and Frequency
See also
-
 No. 5,661
27 Sep 2025
17 min
Understanding the Power of Wedge Patterns in Technical Analysis
Finance Policy
No. 5,661
27 Sep 2025
17 min
Understanding the Power of Wedge Patterns in Technical Analysis
Finance Policy -
 No. 3,232
11 Mar 2025
19 min
Understanding Momentum Investing: Chasing Performance with Technical Analysis
Investments
No. 3,232
11 Mar 2025
19 min
Understanding Momentum Investing: Chasing Performance with Technical Analysis
Investments -
 No. 2,718
29 Jan 2025
17 min
Understanding the Klinger Oscillator: A Powerful Technical Indicator for Trend Identification and Reversal Signals
Financial Data Analysis
No. 2,718
29 Jan 2025
17 min
Understanding the Klinger Oscillator: A Powerful Technical Indicator for Trend Identification and Reversal Signals
Financial Data Analysis -
 No. 2,094
09 Dec 2024
19 min
Understanding the Herrick Payoff Index: A Forward-Looking Technical Analysis Tool for Derivatives Markets
Financial Tools
No. 2,094
09 Dec 2024
19 min
Understanding the Herrick Payoff Index: A Forward-Looking Technical Analysis Tool for Derivatives Markets
Financial Tools -
 No. 1,082
25 Jul 2024
20 min
Understanding Divergence in Technical Analysis: Positive and Negative Signals
Financial Data Analysis
No. 1,082
25 Jul 2024
20 min
Understanding Divergence in Technical Analysis: Positive and Negative Signals
Financial Data Analysis -
 No. 892
26 Jun 2024
17 min
Decoding the Death Cross: Understanding This Market Indicator’s Significance and Limitations
Markets
No. 892
26 Jun 2024
17 min
Decoding the Death Cross: Understanding This Market Indicator’s Significance and Limitations
Markets