Net Interest Income: The Key Financial Metric for Banks

Net interest income is interest earned minus interest paid. US banks earned $197.4 billion of it in Q2 2026, a 3.32% net interest margin.
Net interest income (NII) is the interest a bank earns on its loans and investments minus the interest it pays on deposits and borrowings. It is the core of how a bank makes money: take in funds at one rate, lend or invest them at a higher one, and keep the difference. In the second quarter of 2026, the 4,238 FDIC-insured banks and savings institutions earned $318.4 billion in interest, paid $121.0 billion, and kept $197.4 billion of net interest income, according to the FDIC's Quarterly Banking Profile.
The companion measure is the net interest margin (NIM), which divides NII by the bank's average earning assets to express it as a percentage. The industry's NIM was 3.32% in that quarter. This page covers what NII means, the formula, a worked example with real arithmetic, how analysts break down the margin, how banks compare, and what happens to NII when the Federal Reserve moves rates. It is general information, not investment advice about any bank.
What Net Interest Income Means (NII in Banking)
When people ask "what is NII in banking," the short answer is the bank's interest spread measured in dollars. A bank's balance sheet has two sides:
- Interest-earning assets: loans (mortgages, business loans, credit cards, auto loans), investment securities such as Treasuries and mortgage-backed securities, and cash held at the Federal Reserve or other banks.
- Interest-bearing liabilities: savings, money market and certificate of deposit accounts, plus borrowed money such as Federal Home Loan Bank advances and bonds the bank has issued.
Interest flows in from the first group and out to the second. NII is what is left. It is revenue, not profit: the bank still has to pay salaries and rent, set aside money for loans that may go bad, and pay taxes.
NII is the largest source of revenue for most banks. In Q2 2026 the industry's net operating revenue, defined by the FDIC as net interest income plus noninterest income, was $293.5 billion, so NII made up about two-thirds of it. The rest came from fees, trading, card interchange and similar sources. For community banks the share is higher; the FDIC reports net interest income at about 83% of operating revenue for community banks in the first half of 2026. That is why bank analysts, and bank stock prices, react so strongly to anything that might change NII.
Your own accounts are part of it. The rate your bank pays on your savings sits on the expense side, and the rate on your mortgage or credit card sits on the income side. The FDIC's national rates put the average savings account at 0.37% as of September 21, 2026, while the Federal Reserve's G.19 release shows credit card accounts charged interest averaging 22.15% in May 2026. The distance between those two rates is where NII comes from.
The Net Interest Income Formula
The net interest income formula is a subtraction:
Net interest income = Total interest income − Total interest expense
Each side is itself a sum of balances multiplied by rates:
- Interest income = average balance of each earning asset × the yield on it, added up across loans, securities and cash.
- Interest expense = average balance of each interest-bearing liability × the rate paid on it, added up across deposits and borrowings.
Using the FDIC's aggregate numbers for Q2 2026: $318.4 billion − $121.0 billion = $197.4 billion. That was up $5.3 billion, or 2.8%, from the first quarter and up $15.4 billion, or 8.5%, from a year earlier.
Two details trip people up. First, NII is usually reported for a quarter or a year, so compare like with like. Second, some banks report NII on a fully taxable-equivalent (FTE) basis, which grosses up tax-exempt interest (for example from municipal bonds) to what it would be if it were taxable. The FDIC's industry figures make no such adjustment; its definition of net interest margin says "no adjustments are made for interest income that is tax exempt." A bank's investor presentation may use FTE figures, so check which one you are reading.
A Worked Example: One Bank's Net Interest Income
Take a hypothetical community bank, Main Street Bank, with $1 billion of average earning assets over a year. The rates are illustrative but close to industry averages for mid-2026.
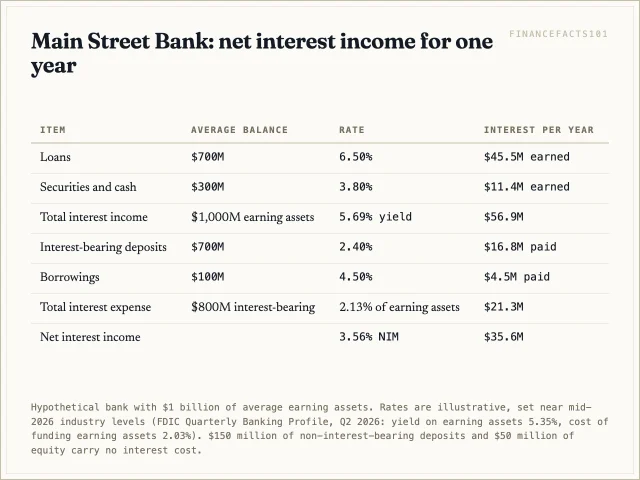
On the asset side, $700 million of loans at an average 6.50% earn $45.5 million and $300 million of securities and cash at 3.80% earn $11.4 million. Total interest income: $56.9 million, a yield on earning assets of 5.69%.
On the funding side, $700 million of interest-bearing deposits at 2.40% cost $16.8 million and $100 million of borrowings at 4.50% cost $4.5 million. Total interest expense: $21.3 million. The bank also has $150 million of checking deposits that pay nothing, plus $50 million of its own equity capital; both fund assets without any interest cost.
Net interest income = $56.9 million − $21.3 million = $35.6 million.
That is not profit. If Main Street Bank sets aside $3 million for expected loan losses and spends $25 million on staff, branches and technology, and earns $6 million in fees, its pre-tax income is $35.6 − $3 + $6 − $25 = $13.6 million. Loans themselves are usually amortizing loans, so balances shrink as borrowers repay and the bank has to keep lending just to hold NII steady.
Net Interest Margin: NII as a Percentage
Dollars of NII grow as a bank grows, so they are useless for comparing a $1 billion bank with a $1 trillion one. Net interest margin solves that:
Net interest margin = Net interest income ÷ Average earning assets
For Main Street Bank: $35.6 million ÷ $1,000 million = 3.56%.
The FDIC defines NIM as "the difference between interest and dividends earned on interest-bearing assets and interest paid to depositors and other creditors, expressed as a percentage of average earning assets." It also publishes the two halves. The yield on earning assets is interest income divided by average earning assets. The cost of funding earning assets is interest expense divided by average earning assets. NIM is simply the first minus the second: 5.69% − 2.13% = 3.56% for Main Street Bank, and 5.35% − 2.03% = 3.32% for the whole industry in Q2 2026.
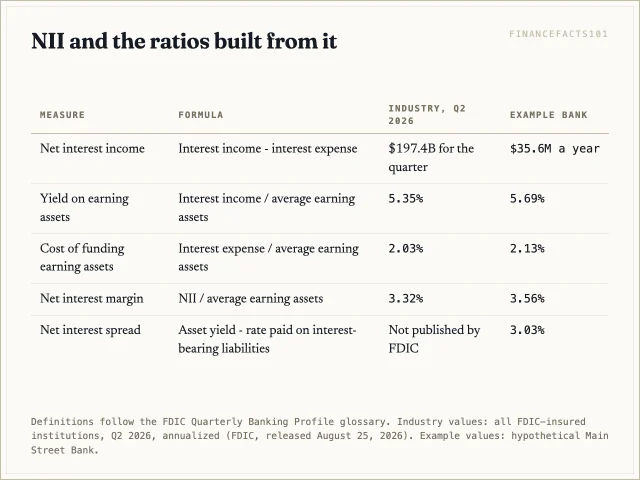
A related number, the net interest spread, subtracts the average rate paid on interest-bearing liabilities, rather than the cost spread over all earning assets, from the asset yield. Main Street Bank pays $21.3 million on $800 million of interest-bearing funds, 2.66%, so its spread is 5.69% − 2.66% = 3.03%. The margin (3.56%) is higher than the spread (3.03%) because $200 million of the bank's assets are funded by free checking deposits and equity. That gap is a quick measure of how valuable a bank's non-interest-bearing deposits are, and it widens when rates are high.
Net Interest Margin Analysis: What Moves the Number
Net interest margin analysis means breaking a change in NIM into its causes. Analysts look at five drivers.
1. Asset yields. Higher-rate loans lift the margin. Credit card lending earns far more than mortgages, but it also loses more to defaults.
2. Funding costs and deposit mix. A bank with lots of non-interest-bearing checking deposits has cheap funding. When customers move money into CDs and high-yield savings, as many did after rates rose in 2022 and 2023, funding costs rise. The site's comparison of high-yield savings and CDs shows the depositor's side of that trade.
3. Deposit beta. This is the share of a market rate change that a bank passes on to depositors. JPMorgan Chase's 2025 Form 10-K describes deposit betas as "the amount by which deposit rates paid could change upon a given change in market interest rates." A low beta lets margins widen when rates rise.
4. Repricing and maturity gaps. A bank holding 30-year fixed mortgages funded by deposits that reprice monthly gains nothing when rates rise, while its funding gets more expensive. A bank with floating-rate business loans, often priced off the prime rate, sees income rise almost immediately.
5. Volume and mix. Loan growth adds NII even at a flat margin. A shift from securities to loans usually raises the margin.
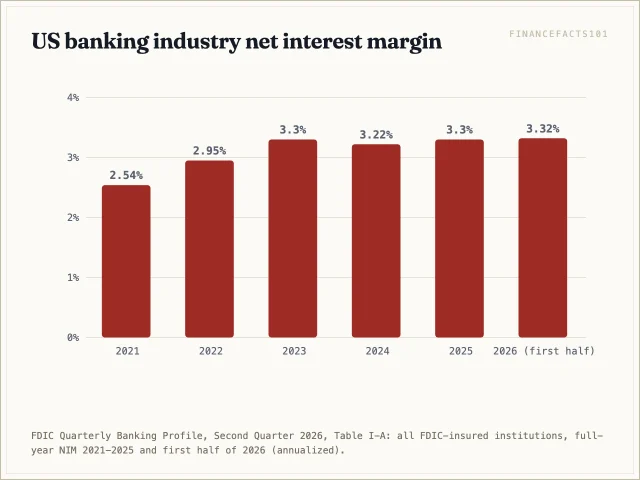
Industry NIM shows these forces at work. It was 2.54% in 2021, when rates were near zero and deposits flooded in, then rose to 3.30% in 2023 as loan and securities yields climbed faster than deposit costs. It dipped to 3.22% in 2024 as deposit costs caught up, returned to 3.30% in 2025, and stood at 3.32% for the first half of 2026. In Q2 2026, the FDIC says NIM rose 1 basis point because the yield on earning assets rose slightly faster (up 2.3 basis points) than the cost of funds (up 1.6 basis points). That is margin analysis in one sentence.
Comparing Banks: Size and Business Model
Two banks with the same NII can be very different businesses, and two with the same NIM can have different risk. Size and business model explain most of the variation.
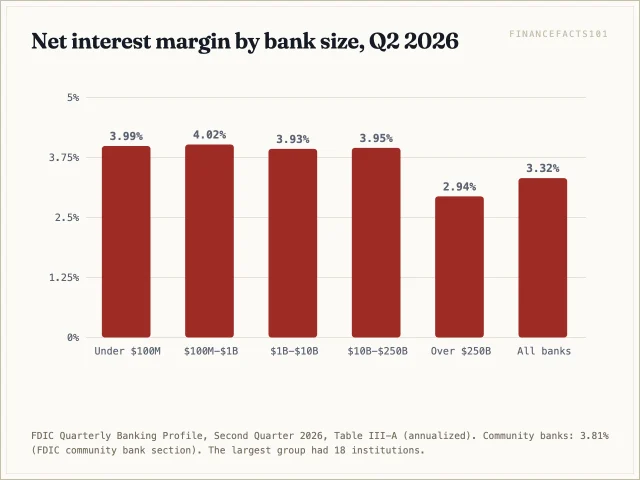
In Q2 2026, banks with $100 million to $1 billion in assets had a NIM of 4.02%, while the 18 banks with more than $250 billion had 2.94%. Community banks as a group earned 3.81%. Smaller banks tend to hold more loans and fewer low-yielding securities, and they rely more on local deposits. The largest banks hold huge trading and securities books that earn thin spreads but produce fee and trading income that NIM does not capture.
Business model matters even more. The FDIC's credit card banks had a NIM of 9.41%, while its mortgage lenders had 2.60%. The card banks are not three times as well run; they lend at much higher rates to riskier borrowers and set aside far more for losses.
A large-bank example shows the scale. JPMorgan Chase's 2025 Form 10-K reports total interest income of $193.3 billion, interest expense of $97.9 billion, and net interest income of $95.4 billion, up 3% from 2024. On $3.8 trillion of average interest-earning assets, its net yield was 2.50% on an FTE basis, or 3.75% excluding its Markets business. That is why a single "NIM" figure for a universal bank needs context. When you compare, match banks of similar size and business, compare the same basis (FTE or not), and look at the trend across several quarters rather than one.
How Interest Rate Changes Affect NII
Rising rates do not automatically raise NII. The effect depends on which side of the balance sheet reprices faster. The OCC's Comptroller's Handbook on interest rate risk splits the exposure into four parts: repricing risk, basis risk, yield curve risk and options risk. Banks model the effect on NII with rate "shock" scenarios.
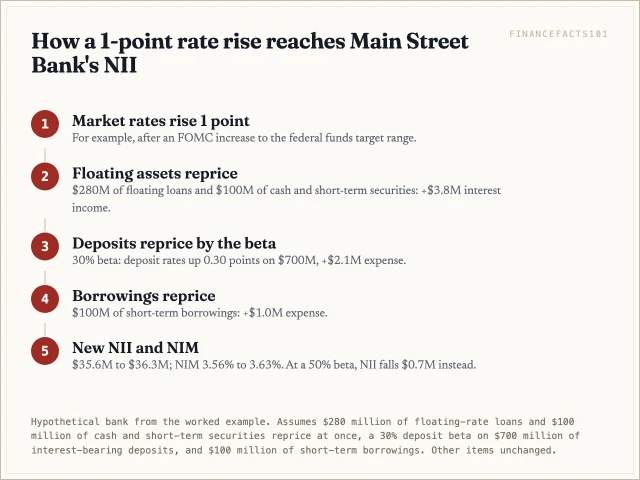
Consider Main Street Bank again, and assume rates rise 1 percentage point. Its $280 million of floating-rate loans and $100 million of cash and short-term securities reprice, adding $3.8 million of interest income. Its deposit beta is 30%, so deposit costs rise 0.30 points on $700 million, or $2.1 million, and its $100 million of short-term borrowings cost $1.0 million more. Interest expense rises $3.1 million. NII goes from $35.6 million to $36.3 million, and NIM from 3.56% to 3.63%. Change the beta to 50% and the gain disappears: deposit costs would rise $3.5 million and NII would fall by $0.7 million.
Large banks publish these estimates. JPMorgan's 10-K describes its "earnings-at-risk" measure as "a sensitivity to a baseline, which includes net interest income and certain interest rate sensitive fees." As of December 31, 2025, it estimated that an instant, parallel 1-point rise in rates would raise that baseline by $2.1 billion over 12 months, and a 1-point fall would lower it by $2.4 billion. The current direction matters too. The Federal Reserve raised its target range to 3.75% to 4.00% on September 16, 2026, the first increase since 2023. Asset-sensitive banks stand to gain from that, depending on how much of the increase they pass on to depositors.
Net Interest Income vs Other Bank Metrics
NII answers one question: how much does the bank earn from the spread? Other metrics answer different ones.
- Net interest margin measures NII relative to earning assets, which makes it the tool for comparing banks of different size.
- Net income is what remains after provisions for credit losses, noninterest expenses and taxes. A bank can grow NII and still lose money if loans go bad.
- Return on assets (ROA) divides net income by total assets. The industry's ROA was 1.37% in Q2 2026.
- Efficiency ratio is noninterest expense divided by revenue; lower is better. It shows whether a high NII is being eaten by costs.
- Noninterest income covers fees, trading and wealth management. Banks with large fee businesses depend less on NII.
A rising NII with a falling NIM usually means growth, with the bank adding assets at thinner spreads. A rising NIM with falling NII usually means shrinkage. Read the two together.
"Net Interest" Outside Banking
The phrase "net interest" also shows up outside bank statements, with the same logic and different signs.
For a non-bank company, the income statement often shows interest expense, net or net interest expense: interest paid on the company's debt minus interest earned on its cash. For most businesses this is a cost, not a revenue line. For a bank, net interest is the main business.
For a household, net interest is the interest you earn minus the interest you pay. If you hold $10,000 in savings at the FDIC's 0.37% national average, you earn $37 a year. Carry a $5,000 card balance at the 22.15% average and you pay about $1,108. Your net interest is roughly −$1,070 a year. The bank on the other side keeps that spread, less its costs and losses. Moving savings to a higher-rate deposit account and paying down card debt shrinks the gap from your side.
FAQ
What is a good net interest margin for a bank?
There is no single target. The industry average was 3.32% in Q2 2026, community banks averaged 3.81%, and banks over $250 billion averaged 2.94%. Credit card banks run far higher and mortgage lenders lower. Compare a bank with peers of similar size and business, and watch its trend over several quarters.
Is net interest income the same as net income?
No. Net interest income is interest earned minus interest paid. Net income is what is left after also subtracting credit loss provisions, operating expenses and taxes, and adding fee income. In Q2 2026 US banks had $197.4 billion of NII and $90.1 billion of net income.
Do higher interest rates always increase a bank's net interest income?
No. They help banks whose assets reprice faster than their deposits, called asset-sensitive banks. They hurt banks holding long fixed-rate loans funded by deposits that reprice quickly. How much of each rate change the bank passes to depositors, its deposit beta, often decides the result.
How do you calculate net interest income from a bank's financial statements?
Find "total interest income" and "total interest expense" on the income statement and subtract the second from the first. Most banks show the result directly as "net interest income." To get the margin, divide it by average earning assets, which banks report in their average balance sheet tables, and annualize quarterly figures.
Sources
- FDIC, Quarterly Banking Profile, Second Quarter 2026 (released August 25, 2026) — Table II-A income data ($318.4 billion interest income, $121.0 billion interest expense, $197.4 billion NII); Table I-A annual NIM 2021–2026; Table III-A yield, cost of funds and NIM by asset size and specialty group; community bank NIM 3.81%; net interest income to operating revenue for community banks; glossary definitions of net interest margin, yield on earning assets and cost of funding earning assets
- FDIC, National Rates and Rate Caps — national average savings rate 0.37% as of September 21, 2026
- Federal Reserve, G.19 Consumer Credit — credit card interest rate 22.15% on accounts assessed interest, May 2026
- Federal Reserve, FOMC statement, September 16, 2026 — federal funds target range raised to 3.75% to 4.00%
- JPMorgan Chase & Co., 2025 Form 10-K (SEC EDGAR) — interest income $193,341 million, interest expense $97,898 million, net interest income $95,443 million; net yield 2.50% (FTE) and 3.75% excluding Markets; earnings-at-risk of +$2.1 billion / −$2.4 billion for ±100 basis points as of December 31, 2025; definition of deposit betas
- Office of the Comptroller of the Currency, Comptroller's Handbook: Interest Rate Risk (March 2020) — repricing, basis, yield curve and options risk
 Next entry · No. 3,416Understanding the Net Interest Rate Differential (NIRD) and its Role in Carry Trades
See also
-
 No. 3,510
03 Apr 2025
19 min
Understanding Non-Recourse Finance: Repayment from Project Profits Only
Business Finance
No. 3,510
03 Apr 2025
19 min
Understanding Non-Recourse Finance: Repayment from Project Profits Only
Business Finance -
 No. 3,252
13 Mar 2025
21 min
Understanding Money Market Accounts (MMAs): Features, Advantages, Disadvantages, and Comparison with Savings, Checking and Mutual Funds
Business Finance
No. 3,252
13 Mar 2025
21 min
Understanding Money Market Accounts (MMAs): Features, Advantages, Disadvantages, and Comparison with Savings, Checking and Mutual Funds
Business Finance -
 No. 5,864
14 Oct 2025
19 min
Maximizing Portfolio Returns with a Yield Pickup Strategy
Business Finance
No. 5,864
14 Oct 2025
19 min
Maximizing Portfolio Returns with a Yield Pickup Strategy
Business Finance -
 No. 4,619
03 Jul 2025
18 min
Understanding Series EE Bonds: A Comprehensive Guide for Institutional Investors
Business Finance
No. 4,619
03 Jul 2025
18 min
Understanding Series EE Bonds: A Comprehensive Guide for Institutional Investors
Business Finance -
 No. 4,522
25 Jun 2025
18 min
Maximizing Profitability: A Deep Dive into Understanding and Utilizing Return on Net Assets (RONA)
Business Finance
No. 4,522
25 Jun 2025
18 min
Maximizing Profitability: A Deep Dive into Understanding and Utilizing Return on Net Assets (RONA)
Business Finance -
 No. 3,925
08 May 2025
19 min
Decoding Payout Ratio: A Comprehensive Guide for Institutional Investors
Business Finance
No. 3,925
08 May 2025
19 min
Decoding Payout Ratio: A Comprehensive Guide for Institutional Investors
Business Finance