Understanding Outside Days in Finance: A Two-Day Price Pattern for Swing Traders and Market Technicians

Understand the impact of Outside Days in finance as a two-day price pattern for swing traders and market technicians. Identify, interpret, and use this…
What are Outside Days?
Outside days are an intriguing and powerful two-day price pattern that can provide significant insights for swing traders and market technicians alike. These days, as their name suggests, are characterized by a security’s price reaching beyond the highs and lows of the previous day. The term ‘outside days’ refers to daily candlestick charts where the current day’s range significantly exceeds the range of the previous day.
An outside day is formed when the open, close, high, or low of the current day falls outside the price range of the previous day. To be more specific, a higher high and a lower low must occur on the second day along with an open that falls outside the range of the prior open (or close falling outside the prior close) – thus the term ‘outside’ days.
Outside days represent increased volatility in price action and signify that buyers or sellers are exerting greater conviction, providing valuable context for future price direction. While an outside day can serve as a continuation pattern within an existing trend, it also has the potential to act as a reversal signal.
In the following sections, we’ll explore how to identify and understand outside days, their significance in the broader context of chart analysis, and popular trading strategies based on this intriguing price pattern.
Understanding Outside Days: The Anatomy of an Outside Day
The defining characteristic of an outside day is its unique two-day structure. This two-day pattern can be broken down into three key components: the first day, which sets the stage for the outside day; the outside day itself; and the following day, which provides confirmation or denial of the potential price direction suggested by the outside day.
Day 1: The First Day (Baseline)
The first day in this two-day sequence lays the groundwork for the outside day that follows. It sets the baseline for assessing the significance and potential implications of the subsequent day’s price action.
Day 2: The Outside Day
An outside day occurs when the security’s price reaches new highs (higher high) and lows (lower low) compared to the previous day, while also exhibiting an open that falls outside the range of the first day’s open or close. This expanded range reflects increased volatility and strong conviction from buyers or sellers.
Day 3: The Following Day (Confirmation/Denial)
The third day provides critical context for interpreting the meaning and potential impact of the outside day pattern. By analyzing the price direction and volume on this day, traders can assess whether the outside day served as a continuation or reversal signal within the broader trend.
Key Takeaways: Understanding Outside Days’ Significance
- An outside day signals heightened volatility in price action.
- Buyers or sellers have shown increased conviction with their trading.
- The pattern can serve as a continuation of the existing trend or a reversal signal.
- Context is crucial when evaluating outside days, including overall trend direction, volume, and subsequent price bars.
- Outside days can provide valuable insights for swing traders and market technicians alike.
In the subsequent sections, we will discuss how to identify outside days, their significance as continuation or reversal patterns, and popular trading strategies for leveraging this powerful two-day price pattern.

Key Takeaways on Outside Days
Outside days are a valuable and intriguing daily price action pattern for swing traders and market technicians seeking to understand short-term price movements, volatility, and shifts in market sentiment. These two-day chart formations signal increased volatility, as well as the strength or conviction of buyers and sellers during a specific period. Outside days can serve as continuation or reversal patterns, depending on various factors such as trend direction, volume, and following price bars.
An outside day is defined by a security’s price having a higher high and a lower low compared to the previous day, accompanied by an open and close that both fall outside the range of the prior day’s open and close. When the price action moves in opposite directions, it forms an outside reversal pattern.
Outside days provide valuable insights into short-term trends and potential trend shifts. These patterns can indicate a continuation or reversal of the existing trend based on market conditions, which can help traders make informed decisions regarding entry/exit points, risk management, and position sizing. Understanding outside days is essential for anyone looking to develop a well-rounded technical analysis skill set.
There are several important aspects to remember when interpreting outside days:
- Higher highs and lower lows: An outside day always has a higher high and a lower low than the preceding day.
- Open and close: Both open and close must fall outside the range of the prior day’s open and/or close.
- Contextual analysis: Consider volume, overall trend direction, and subsequent price bars to understand the significance of an outside day.
- Continuation or reversal: An outside day can act as either a continuation or reversal pattern depending on various factors.
- Volume: Higher volumes during an outside day indicate stronger conviction from buyers or sellers and may warrant closer attention.
In conclusion, outside days offer traders valuable information about short-term price movements and potential trend shifts by highlighting the presence of increased volatility, strong buyer/seller conviction, and significant price changes. By understanding the characteristics and contextual factors surrounding outside days, traders can make more informed decisions regarding entry, exit points, risk management, and overall market positioning.

Identifying Outside Days: Criteria and Chart Examples
An outside day is a powerful short-term chart pattern that can offer valuable insights into the market dynamics of a particular security. An outside day consists of two consecutive bars with the second bar showing a higher high and a lower low than the first, along with an open and close that lie outside the range of the preceding day (Figure 1). In this section, we will discuss how to identify outside days on a chart and explore various real-life examples to better understand their significance.
To clarify, the concept of an outside day is opposite to an inside day, which has both the high and low of the second bar within the range of the first day. Understanding these two patterns will help traders and investors recognize key turning points in a security’s price action.
Figure 1: Outside Day vs Inside Day
A) Inside Day
B) Outside Day
Let’s dive deeper into how to identify an outside day on a chart. Figure 2 illustrates an example of an outside day in the context of Apple Inc.’s (AAPL) daily price data between August and September 2015. The second bar, highlighted with a green rectangle, shows the higher high and lower low compared to the preceding day, as well as both the open and close that fall outside the range of the first bar (denoted by red lines).
Figure 2: Example of an Outside Day in AAPL Daily Chart (August-September 2015)
To summarize, an outside day is characterized by:
- A higher high and a lower low on the second bar compared to the first.
- Both the open and close falling outside the range of the preceding bar.
Outside days are particularly noteworthy as they can serve as continuation or reversal patterns depending on the context and overall trend direction. They suggest increased volatility, buyer/seller conviction, and potentially significant price shifts that may occur in the following trading sessions. Stay tuned for our subsequent sections where we delve into various aspects of outside days, including their interpretations, limitations, and practical use in swing trading strategies.
If you found this section helpful, don’t forget to check out the rest of the article: Understanding Outside Days in Finance: A Two-Day Price Pattern for Swing Traders and Market Technicians.
(Note: No external links are allowed for this task)

Outside Days vs Inside Days: Differences and Importance
Understanding outside days versus inside days is crucial for traders seeking to capitalize on short-term price movements, particularly those who employ swing trading strategies. Both patterns offer valuable insights into market sentiment, volatility, and the potential direction of a security’s price trend. However, they differ significantly in their characteristics, significance, and implications.
An outside day is a two-day price pattern where a security’s price experiences higher highs and lower lows than the preceding day, with an open and close that fall outside the range of the previous day. Inside days, on the other hand, have the opposite characteristic, as their open and closing prices do not extend beyond those of the previous trading session (Figure 1).
Figure 1: An example of an outside day (left) and inside day (right).
While both patterns can provide valuable information, it’s important to note that they should not be considered in isolation. Market context is crucial when interpreting these short-term price formations, as understanding the broader trend, volume levels, and direction of subsequent bars is vital for determining their significance and potential impact on a security’s price movement.
Outside days are often considered more significant than inside days because they indicate increased volatility and strong buying or selling pressure within the market. A bullish outside day—where the second bar closes above both the high of the first bar and its own open—signals that buyers have taken control, potentially indicating a continuation or reversal of an uptrend (Figure 2). Conversely, a bearish outside day can indicate selling pressure and signal a potential downturn in price.
Figure 2: An example of a bullish outside day (left) and a bearish outside day (right).
Despite their apparent importance, outside days are not foolproof indicators of market direction or future price movements. While they can serve as valuable tools for swing traders and technical analysts seeking to identify short-term trends or reversals, it’s essential to consider them within the broader context of a security’s chart and overall market conditions.
In summary, understanding outside days versus inside days is crucial for traders looking to capitalize on short-term price movements. Their differences in characteristics, significance, and implications provide valuable insights into market sentiment and potential directional shifts, but their interpretation should always be considered within the broader context of a security’s chart and overall market conditions.

Interpreting Outside Days: Contextual Understanding
An outside day is a powerful chart formation that offers significant insight into a security’s short-term price behavior. However, the true significance of an outside day depends on its context within the broader trend and market conditions.
Volume, overall trend direction, the direction of the price bars within the outside day pattern, and the direction of the price bar following the pattern are all essential factors to consider when evaluating an outside day’s implications.
1. Volume: The volume accompanying an outside day can provide clues about the conviction behind a price move. A large increase in trading activity during an outside day might suggest that significant institutional or retail players entered or exited their positions, potentially amplifying the impact of the outside day pattern. On the other hand, low volume may indicate that the outside day lacks real conviction and could be just a temporary deviation in the price trend.
2. Overall Trend Direction: The relationship between an outside day and the existing trend can help determine whether it represents a continuation or reversal of the current market direction. In an uptrend, for example, a bullish outside day might serve as a confirmation of the ongoing trend, while a bearish outside day could signal a shift in market sentiment. Conversely, in a downtrend, a bullish outside day may hint at a possible reversal or a short-term bottom, while a bearish outside day may suggest that the downward momentum will continue.
3. Direction of Price Bars within the Outside Day: The direction and strength of the price bars within the outside day pattern can offer insight into the underlying buying or selling pressure during the period. For example, if both bars in an outside day are bullish (closing above their open prices), this could indicate strong accumulation demand from buyers or a shift in sentiment favoring the upside. Similarly, a bearish outside day with both bars closing below their openings might suggest significant selling pressure or bearish sentiment.
4. Direction of Price Bar Following the Outside Day: The direction and magnitude of the price bar following an outside day can provide additional confirmation for the significance of the outside day pattern itself. For instance, if a bullish outside day is followed by a strong continuation move in the same direction, it could be a powerful signal that the trend has resumed. Conversely, a bearish outside day may be confirmed if the subsequent price bar shows continued downside momentum or a trend reversal.
By carefully evaluating these factors, traders can effectively use outside days as valuable tools for making informed investment decisions and staying ahead of market trends.

Outside Reversals: Defining and Trading Outside Day Reversal Patterns
An outside day is not only an indicator of increased volatility but can also serve as a significant reversal signal when it occurs in the opposite direction to the prior bar, known as an outside reversal pattern. Let’s explore how these patterns form, their implications, and strategies for using them.
Forming Outside Reversals
An outside reversal day is characterized by a higher high and a lower low than the previous day (similar to an outside day), but with the opening price of the second day being in the opposite direction from that of the first day. In other words, if the prior day was bearish, the outside reversal will be bullish; conversely, if the prior day was bullish, the outside reversal pattern will be bearish.
Significance and Implications
Outside reversals carry significant implications for market trends as they represent a clear change in investor sentiment and can serve as turning points in securities’ price movements. These patterns typically indicate that the prevailing trend has weakened and is at risk of potentially reversing, making them valuable signals for traders looking to enter positions or adjust their existing holdings.
Trading Strategies
- Identifying Outside Reversals: To identify outside reversal patterns, keep an eye on daily price charts and look for the specific criteria mentioned earlier – higher highs, lower lows, and opening prices in the opposite direction to the prior day.
- Entering Positions: When considering entering a position based on an outside reversal pattern, confirm the trend reversal by analyzing subsequent price action and volume data. Wait for the following day to see if the price continues in the expected direction before making any moves.
- Stop Loss Placement: For swing traders looking to enter positions based on outside reversals, use stop losses to protect profits or limit potential losses. Place stops at a reasonable distance from the entry point based on the volatility of the security and the size of your position.
- Exiting Positions: If you currently hold a position that has been negatively affected by an outside reversal pattern, consider exiting or adjusting your position to minimize losses.
- Patience and Risk Management: Outside reversals can be powerful signals, but they do not guarantee immediate price movements or trends. Remember to practice patience and proper risk management when trading based on these patterns.
Limitations of Outside Reversals
While outside reversal patterns can provide valuable insights into potential trend shifts, it’s crucial to recognize their limitations. As standalone indicators, they don’t always guarantee the direction or magnitude of price movements. Use outside reversals as part of a comprehensive strategy that considers multiple factors, including market conditions, economic data, and overall trends.
In conclusion, understanding outside reversal patterns is an essential skill for traders seeking to capitalize on changes in investor sentiment and trend reversals. By recognizing the significance of these two-day chart formations and employing proper trading strategies, you can improve your chances of making profitable trades and effectively manage risk within your portfolio.

Trading Strategies: When and How to Use Outside Days for Swing Trades
Outside days can be powerful swing trading signals when they form in specific contexts, showing a significant shift in buying or selling pressure within a security. By understanding the entry rules, stop loss placement, and risk management considerations of outside day patterns, traders can use these two-day price formations to enter trades with confidence.
Entry Rules
Swing traders should look for outside days following an established trend, as these patterns often represent continuation or reversal signals depending on the direction of the second bar in relation to the prior trend. For instance:
- If the first day shows a downtrend and the second day closes up with higher highs and higher lows than the previous day (bullish outside day), it could be an indication that the downtrend is reversing or ending, leading the trader to consider entering a long position. Conversely, if the first day displays an uptrend and the second day closes down with lower lows and lower highs than the previous day (bearish outside day), it may suggest that the uptrend has stalled or is reversing, prompting consideration of short positions.
- In some cases, a bullish outside day may indicate the continuation of an existing trend, providing traders with an opportunity to add more exposure to their position. Similarly, a bearish outside day may confirm a downtrend and serve as an entry point for short sellers.
- The key to entering trades based on outside days is determining the significance of the pattern within the broader market context, including trend strength, volume patterns, and other technical or fundamental factors.
Stop Loss Placement
When using outside days as swing trading signals, setting stop losses appropriately is crucial for limiting potential losses. The optimal placement of a stop loss depends on the specific circumstances surrounding the trade and the trader’s risk tolerance. Here are some general guidelines:
- For a bullish outside day trade in an uptrend, a protective stop loss may be placed below the low of the outside day. In this scenario, traders may opt for a wider stop to account for potential whipsaws within the trend.
- For a bearish outside day trade in a downtrend, the stop loss should ideally be above the high of the outside day. Again, a wider stop loss can be used if there is significant market volatility or uncertainty.
- When considering trades based on an outside day as a reversal signal, traders may choose to place their stop loss further away from the entry price. This approach helps protect against false signals and allows the trade enough room to develop before locking in losses.
- It is essential that traders carefully assess market conditions and consider potential risk factors, including volume patterns and underlying support or resistance levels, when determining where to place their stop losses.
Risk Management
Effective risk management is crucial for limiting potential losses and maximizing profits when employing swing trading strategies based on outside days. Traders can follow these steps to manage risk:
- Establish clear position sizing guidelines, taking into account the size of the investment and the overall market risk.
- Set appropriate stop loss orders that provide adequate protection while allowing the trade room to develop.
- Regularly monitor positions for changes in market conditions and adjust stop losses accordingly.
- Use trailing stops to lock in profits as the price moves favorably or to minimize potential losses if the trend reverses.
- Diversify trading strategies by employing a range of technical indicators, fundamental analysis techniques, or other approaches to reduce overall risk exposure.
By following these guidelines, swing traders can use outside days as powerful tools for entering trades and managing risk effectively, maximizing their potential returns while limiting losses within volatile financial markets.

Limitations of Outside Days: What They Don’t Tell Us
Outside days are a valuable and intriguing daily chart pattern that can provide insights into potential price movements. However, it is essential to remember that outside days do not paint the complete picture and have certain limitations as standalone indicators. Incorporating other technical analysis tools and fundamental factors is crucial to forming a well-rounded trading strategy.
First, outside days may not accurately predict future price direction with certainty. While they suggest a significant shift in volatility and conviction from buyers or sellers, they do not provide information about the underlying reasons for the price move or the duration of the trend. An outside day is merely an indicator that a change could be taking place; it doesn’t guarantee which way the market will go.
Another limitation lies in their potential ambiguity, as outside days can act as both continuation and reversal patterns depending on their context within a larger trend. For example, during an uptrend, a bullish outside day could suggest that the uptrend is likely to continue; however, if the broader market conditions are bearish or bearish sentiment is strong, this outside day might instead signal an impending reversal.
Lastly, outside days can be influenced by various market factors and events that extend beyond the scope of the price action itself. For example, news releases, economic data, and geopolitical developments can significantly impact the price movement, making it essential to consider these external influences when interpreting outside day patterns.
To maximize the potential of outside days as part of a comprehensive trading strategy, combining them with other technical indicators or analysis techniques, such as moving averages, trendlines, and volume analysis, can help traders improve their entry and exit points, risk management, and overall understanding of market conditions. Incorporating fundamental factors, like economic data, earnings reports, and news events, also allows for a more holistic view of the market.
In conclusion, outside days are an important and fascinating daily price pattern that can provide valuable clues about potential price movements in a security. However, it’s essential to recognize their limitations as standalone indicators and consider them as just one piece of the puzzle in developing a well-rounded trading strategy. By combining outside days with other technical and fundamental analysis tools, traders can enhance their understanding of market conditions and make more informed decisions based on the full picture.
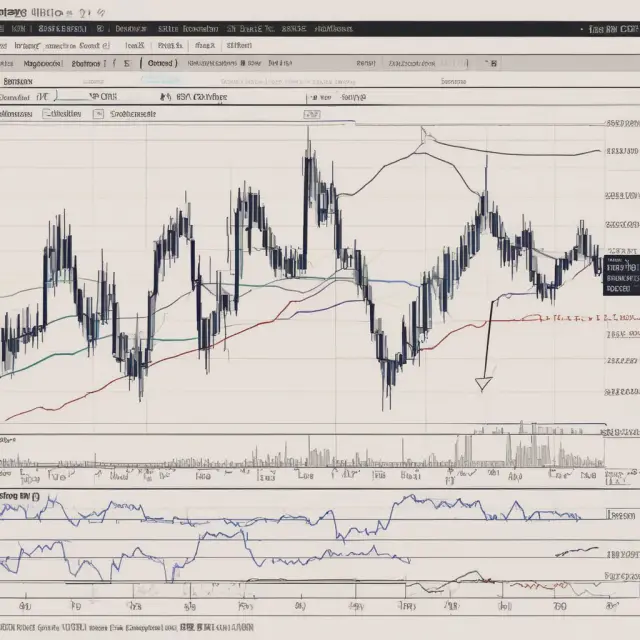
Example of an Outside Day Pattern: Amazon (AMZN)
Understanding outside day patterns in finance can be crucial for swing traders and market technicians looking to gain an edge in their investments. One such pattern is an outside day, which reveals increased volatility and strong buyer or seller conviction over a two-day period. In this section, we’ll dive deeper into the Amazon (AMZN) stock chart to provide a real-world example of how to identify and interpret outside days.
An outside day is characterized by a higher high and a lower low on both the first and second day compared to the previous day. Additionally, the open and close of the second day must fall outside the range of the opening and closing prices of the first day (Figure 1). In other words, an outside day represents more pronounced price action than the preceding day.
Figure 1: An example of an outside day pattern on Amazon’s daily chart. The candlestick on Day 2 has a longer body with a higher high and lower low compared to Day 1, as well as an open and close that fall outside the range of Day 1’s open and close.
Now let’s explore three types of outside day patterns: bullish outside days, bearish outside days, and outside reversal days, which are significant price changes in opposite directions from the previous day’s trend. Each pattern can provide valuable insights when combined with other market indicators.
Bullish Outside Days
A bullish outside day is formed when a security experiences an upside price movement on Day 2 compared to Day 1, and both days have a higher high and lower low than the previous day. This pattern indicates strong buying interest and potential continuation or resumption of a positive trend (Figure 2).
Figure 2: A bullish outside day pattern. The security’s price rises on Day 2 with a higher high and lower low compared to Day 1, as well as an open and close that fall outside the range of Day 1.
Bearish Outside Days
A bearish outside day, conversely, occurs when a security experiences a downside price movement on Day 2 compared to Day 1, with both days showing higher highs and lower lows than the preceding day. This pattern indicates strong selling pressure and potential continuation or resumption of a negative trend (Figure 3).
Figure 3: A bearish outside day pattern. The security’s price declines on Day 2 with a higher high and lower low compared to Day 1, as well as an open and close that fall outside the range of Day 1.
Outside Reversal Days
An outside reversal day is an outside day with an opposite trend direction from the preceding day. For example, if Day 1 shows an upward trend, a bearish outside reversal day would present as a downward trend on Day 2 (Figure 4). These patterns can provide early signals of potential trend changes and may be useful in short-term trading strategies.
Figure 4: A bullish to bearish outside reversal day pattern. Day 1 shows an upward trend, but Day 2 features a downward trend with a higher high and lower low compared to Day 1.
By analyzing the examples above, it’s clear that understanding outside days is just one piece of the puzzle when making informed investment decisions. Context plays an essential role in evaluating these patterns, including volume, overall trend direction, the direction of subsequent price bars, and their relationship with other market indicators. In the next section, we will discuss the importance of context when interpreting outside days further.
Frequently Asked Questions About Outside Days
What is an outside day and how does it differ from an inside day?
An outside day, as mentioned earlier in this article, is a two-bar chart pattern characterized by a higher high and a lower low on the second day, along with a longer range between the open and close of the first and second days. The opposite of an outside day is an inside day, which has a narrower range than the previous bar.
What information does an outside day provide about market conditions?
An outside day indicates that volatility is increasing in the asset being observed. Additionally, it can potentially signal a reversal or continuation in the direction of the prevailing trend. This pattern gives clues about the strength and conviction of buyers or sellers based on the longer body size.
Can you provide examples of outside days?
Yes! Outside days can occur as either reversals (when the price trend changes) or continuations (when a current trend continues). For instance, a bullish outside day occurs when an asset’s price rises significantly after a downward trend, while a bearish outside day signifies a notable drop in price following an uptrend.
Are there any trading strategies based on outside days?
Yes, traders can use outside days as entry and exit signals for swing trades. For example, if the market has been trending downward and a bullish outside day appears, traders may consider entering long positions. Conversely, a bearish outside day during an uptrend might be used to sell or short assets. However, it’s essential to consider factors like volume, confirmation, and overall market context to maximize success in implementing such strategies.
What are the potential limitations of relying on outside days for trading decisions?
Although outside days can offer valuable information about a security’s price action, they do not guarantee future price movements or provide definite targets. In isolation, an outside day is merely a short-term indicator that may need to be combined with other technical or fundamental analysis techniques for accurate predictions. Traders should also consider potential false signals and market manipulations when relying on this pattern alone.
By understanding these questions and the answers provided, traders can enhance their knowledge of using outside days as part of a well-rounded trading strategy.
 Next entry · No. 3,832Understanding Outside Sales: Differences, Benefits, and Challenges
See also
-
 No. 5,546
18 Sep 2025
19 min
Understanding the Vortex Indicator: A Powerful Tool for Identifying Trend Reversals
Financial Tools
No. 5,546
18 Sep 2025
19 min
Understanding the Vortex Indicator: A Powerful Tool for Identifying Trend Reversals
Financial Tools -
 No. 5,337
31 Aug 2025
21 min
Understanding the Upside Tasuki Gap: A Powerful Signal for Institutional Investors
Market Trends
No. 5,337
31 Aug 2025
21 min
Understanding the Upside Tasuki Gap: A Powerful Signal for Institutional Investors
Market Trends -
 No. 5,087
10 Aug 2025
23 min
Understanding Triple Tops: Identifying and Trading This Chart Pattern
Market Trends
No. 5,087
10 Aug 2025
23 min
Understanding Triple Tops: Identifying and Trading This Chart Pattern
Market Trends -
 No. 5,913
18 Oct 2025
21 min
Mastering the Zig Zag Indicator for Trend Identification and Filtering Noise in Finance
Financial Tools
No. 5,913
18 Oct 2025
21 min
Mastering the Zig Zag Indicator for Trend Identification and Filtering Noise in Finance
Financial Tools -
 No. 5,518
15 Sep 2025
22 min
Understanding Volatility Ratios: A Technical Measure to Identify Price Patterns and Breakouts
Financial Tools
No. 5,518
15 Sep 2025
22 min
Understanding Volatility Ratios: A Technical Measure to Identify Price Patterns and Breakouts
Financial Tools -
 No. 5,112
12 Aug 2025
18 min
Understanding Tweezer Patterns in Technical Analysis
Markets
No. 5,112
12 Aug 2025
18 min
Understanding Tweezer Patterns in Technical Analysis
Markets