Understanding the Vortex Indicator: A Powerful Tool for Identifying Trend Reversals
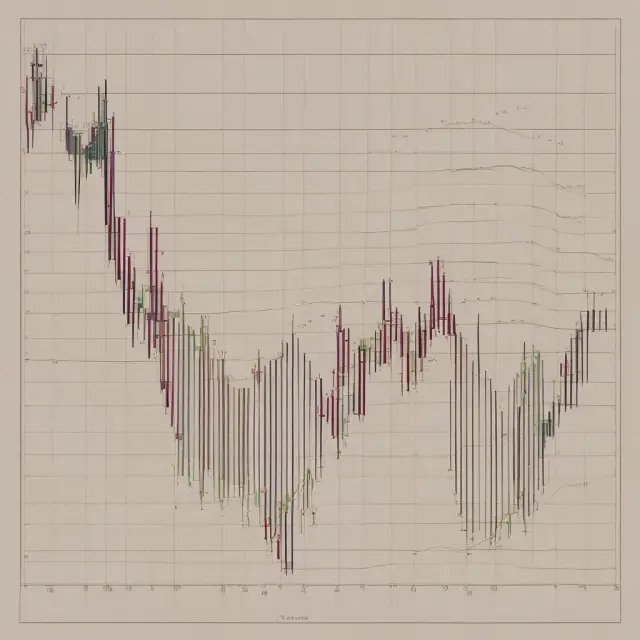
Understand the power of the Vortex Indicator for trend reversal identification in trading with this comprehensive guide.
Introduction to the Vortex Indicator (VI)
The Vortex Indicator (VI), a popular technical analysis tool, consists of two lines – VI+ and VI- – which are primarily colored green and red respectively. Developed by Etienne Botes and Douglas Siepman in 2009, the vortex indicator offers traders valuable insights into trend reversals and current trends.
The calculation of the vortex indicator is rooted in determining true ranges and uptrend and downtrend movements. First, a true range (TR) is established by taking the greatest value between:
– The current high minus the previous close
– The current high minus the prior high
– The prior low minus the current low
Next, calculate the uptrend movement (VM+) as the absolute difference between the current high and the prior low. Determine the downtrend movement (VM-) by calculating the absolute difference between the current low and the prior high. Set a parameter length (n), typically between 14 and 30 days, to sum the last n period’s true range, VM+, and VM-. The VI+ and VI- lines are created by dividing these sums:
VI+ = Sum of the last n periods’ true range / SUM TRn
VI- = Sum of the last n periods’ VM- / SUM TRn
These lines provide crucial trend information when plotted below a candlestick chart. The traditional application of VI+ and VI- crossovers can be susceptible to false trade signals in choppy markets, particularly short-term trends. Enhance the indicator’s accuracy by increasing the number of periods used, such as using 25 periods instead of 14.
The vortex indicator is often integrated into other reversal trend patterns to bolster signal strength. VI+ and VI- lines are plotted below a candlestick chart for visual representation. The example below demonstrates changing signals on a candlestick chart:
In an uptrend or buy signal, VI+ lies beneath VI-, but then crosses above VI- to take the top position among the trendlines. Conversely, during a downtrend or sell signal, VI- resides below VI+, and VI- crosses above VI+ to claim the superior trendline position. Ultimately, the line in the upper position signifies whether the security is experiencing an uptrend or downtrend.

Calculation Methodology
The vortex indicator (VI) is a technical analysis tool consisting of two lines – the uptrend line (VI+) and the downtrend line (VI-). These trendlines are displayed below candlestick charts, with VI+ typically represented in green and VI- in red. Developed by Etienne Botes and Douglas Siepman in 2009, the vortex indicator is designed to detect trend reversals and provide insights into market movements.
To understand how this powerful technical analysis tool functions, we must delve deeper into its calculation methodology. This process involves four distinct components: true range, uptrend and downtrend movement, parameter length (n), and the creation of VI+ and VI-.
1. True Range Concept
The foundation of the vortex indicator lies in the concept of true range. True range is determined by calculating the greatest of three possible values:
– The current high minus the previous close
– The current high minus the prior low
– The current low minus the prior close
2. Uptrend and Downtrend Movement
After identifying true range, we calculate the uptrend movement (VM+) as the absolute value of the difference between the current high and the prior low. Conversely, the downtrend movement (VM-) is calculated as the absolute difference between the current low and the prior high.
3. Parameter Length (n)
Choosing a suitable parameter length (n) is an essential step in calculating the vortex indicator. Commonly, n ranges from 14 to 30 days. By summing the last n periods’ true range, VM+, and VM-, we can proceed to formulate VI+ and VI-.
4. Creating VI+ and VI-
Finally, we calculate VI+ by dividing the sum of the last n periods’ uptrend movement (SUM VMn+) by the total sum of true ranges over the same timeframe (SUM TRn). Similarly, VI- is calculated by dividing the sum of the last n periods’ downtrend movement (SUM VMn-) by SUM TRn.
Daily calculations of VI+ and VI- result in a continuously updated indicator, providing insights into the market trend and potential reversals. The traditional application of VI- and VI+ crossovers can sometimes generate false trade signals, particularly in choppy markets. Increasing the number of periods used in the indicator helps mitigate this issue. For instance, using 25 periods instead of the standard 14 can strengthen the accuracy of the vortex indicator’s signals.
In conclusion, understanding the calculation methodology behind the vortex indicator enables traders to effectively use this valuable technical analysis tool to identify potential trend reversals and confirm existing trends. By recognizing how VI+ and VI- are calculated, we can make informed decisions and enhance our trading strategies accordingly.

Traditional Application of VI+ and VI-
The Vortex Indicator (VI) is a powerful tool in identifying trend reversals through its two prominent lines – the uptrend line (VI+) and the downtrend line (VI-). These lines are typically displayed in contrasting colors, with green for VI+ and red for VI-. The traditional application of using VI+ and VI- crossovers can significantly impact investment decisions.
To understand this concept better, let’s delve deeper into the calculation process. In order to create these trendlines, we calculate the true range (TR), uptrend movement (VM+), downtrend movement (VM-), and the parameter length (n). The true range is calculated as the greatest of: current high minus current low, current high minus previous close or current low minus previous close.
Uptrends and downtrends are determined using VM+ and VM- respectively. VM+ is calculated as the absolute value of the current high minus the prior low, while VM- is calculated as the absolute value of the current low minus the prior high. The sum of the last n periods’ true ranges, VM+ and VM-, are then used to calculate VI+ and VI-.
VI+ is calculated by dividing the sum of the last n periods’ VM+ by the sum of the last n periods’ TR, while VI- is calculated by dividing the sum of the last n periods’ VM- by the sum of the last n periods’ TR.
Traditionally, VI+ and VI- are used to confirm current trends or spot potential trend reversals. An uptrend signal, also known as a buy signal, occurs when VI+ is below VI- but then crosses above VI- to take the top position among the two lines. Conversely, a downtrend signal, or sell signal, takes place when VI- is below VI+ and subsequently crosses above VI+.
When an uptrend signal emerges, it indicates that the security is entering a new trend phase. Similarly, a downtrend signal suggests that the security is undergoing a shift to a downward trend. The trendline in the top position generally dictates whether the security is currently in an uptrend or downtrend.
However, in choppy markets, false signals can occur when using short parameter lengths for VI. In such cases, increasing the number of periods used in the indicator can significantly reduce these false signals. For instance, employing a 25-period moving average instead of a 14-period moving average can yield more reliable results.
By incorporating VI+ and VI- into your technical analysis, you will be able to make better informed decisions regarding buying or selling securities based on accurate trend signals. The vortex indicator’s traditional application is a powerful tool for professional investors seeking to identify potential trend reversals.

False Signals in Choppy Markets
One of the potential downsides of using the vortex indicator (VI) to identify trend reversals is its susceptibility to false signals, particularly when market conditions are volatile or choppy. In such instances, VI+ and VI- lines may cross incorrectly, leading traders into making ill-timed decisions. To minimize false signals in the Vortex Indicator, traders can consider increasing the parameter length used in the indicator’s calculation.
The vortex indicator is a popular trend reversal indicator that offers several advantages over other indicators. However, it may yield false signals when market conditions are unpredictable or volatile. When VI+ and VI- lines cross incorrectly due to choppy price action, this can lead to unnecessary trades based on misleading information. To combat these issues, traders have found that increasing the length of the periods used in calculating the indicator’s trendlines (VI+ and VI-) can significantly reduce false signals while maintaining the effectiveness of the indicator in identifying true reversals.
Using a longer period for calculating the trendlines not only filters out noise but also provides a clearer picture of the underlying price action, especially when the market is experiencing high volatility or frequent trend reversals. Increasing the number of periods used from, say, 14 to 25 can significantly decrease the occurrence of false signals in choppy markets while maintaining the overall effectiveness of the indicator.
It’s important for traders and investors to be aware that no single indicator is foolproof. Utilizing multiple indicators and confirming the findings with other analysis tools or methods is a recommended approach to making informed decisions based on technical data. By combining the vortex indicator with other trend-following indicators such as moving averages or Bollinger bands, traders can build a more robust and reliable trading strategy for identifying trend reversals and confirming current trends.
The key takeaway is that while false signals in choppy markets may pose challenges when using the vortex indicator, this powerful tool remains an essential part of a well-rounded technical analysis approach. By being aware of its potential limitations and incorporating additional confirmation tools, traders can mitigate the impact of false signals and maximize the effectiveness of their trend reversal strategy.

Incorporating VI into Reversal Patterns
The Vortex Indicator (VI) can be an incredibly effective tool when it comes to identifying trend reversals. However, its accuracy is enhanced further when used alongside other established reversal patterns. In this section, we delve deeper into how the vortex indicator can be incorporated with various trend patterns for more precise analysis.
To begin with, it’s essential to first understand the basic nature of reversal patterns and the way they function. Reversals are essentially price movements that signal a change in direction from an existing trend. The most common types of reversal patterns include head and shoulders, double tops and bottoms, triangles, and candlestick formations like hammer and inverted hammer.
When using VI with these reversal patterns, there’s a crucial aspect to consider: the confirmation signal. In technical analysis, a confirmation signal is an event or indicator that adds credibility to the primary trend signal generated by a reversal pattern. By employing the vortex indicator as a confirmation tool, traders can gain an extra layer of assurance in their trades.
Now let’s examine how VI works with some common reversal patterns:
1. Head and Shoulders Reversals:
The head and shoulders is a popular reversal pattern characterized by three distinct price peaks. The first and last peak are referred to as ‘left shoulder’ and ‘right shoulder’, respectively, while the middle peak is known as ‘head’. When VI+ crosses above VI- during or just before the right shoulder formation, it serves as an excellent confirmation signal for a potential trend reversal.
2. Double Tops/Bottoms:
Double tops and bottoms are simple yet powerful reversal patterns that form when prices reach the same level twice. The vortex indicator can be utilized to increase the reliability of these patterns by serving as a confirmation tool. A clear uptrend signal (VI+ above VI-) during the formation of a double top, for instance, signifies that an impending downtrend may be in the offing.
3. Triangle Patterns:
Triangles are continuation and reversal patterns with contracting price ranges. These patterns can exhibit both bullish and bearish tendencies depending on their overall structure. The vortex indicator can come into play by serving as an essential confirmation tool when trading triangles. For instance, a bullish triangle may suggest a potential continuation of the prevailing uptrend only if VI+ remains above VI-.
4. Candlestick Formations:
Candlestick patterns like hammer and inverted hammer can generate reversal signals based on their unique shape and price action. The vortex indicator can serve as a powerful confirmation tool when trading these formations by providing an uptrend (buy) or downtrend (sell) signal depending on the situation at hand.
In conclusion, the vortex indicator is an invaluable asset to traders when it comes to identifying trend reversals. By combining VI with various reversal patterns, traders can significantly improve the accuracy of their analysis and make more informed investment decisions. It’s important to note that no single indicator or pattern can guarantee 100% success, and proper risk management techniques should always be employed in conjunction with these tools.

Visual Representation of VI+ and VI- Lines
The Vortex Indicator (VI) is a powerful tool for identifying potential trend reversals and confirming current trends using two lines, VI+ and VI-, displayed below a candlestick chart. Developed by Etienne Botes and Douglas Siepman in 2009, the VI is based on the calculation of true ranges and movement in uptrends (VM+) and downtrends (VM-). Here’s an example of how these lines appear:
1. True range concept: The true range is calculated as the greatest of three possible values:
a. Current high minus current low
b. Current high minus previous close
c. Current low minus previous close
- Uptrend and downtrend movement: VM+ = Absolute value of current high minus prior low, while VM- = Absolute value of current low minus prior high.
- Parameter length (n): Choose a suitable parameter length (commonly between 14 and 30 days) by summing the last n periods’ true range, VM+, and VM-.
Sum of the last n periods’ true range = SUM TRn
Sum of the last n periods’ VM+ = SUM VMn+
Sum of the last n periods’ VM- = SUM VMn−
4. Create the trendlines: VI+ = SUM VMn+/SUM TRn and VI- = SUM VMn-/SUM TRn
To illustrate, in an uptrend or buy signal, VI+ crosses above VI- while below it for a period of time. Conversely, a downtrend or sell signal is identified when VI- crosses above VI+. The trendline that assumes the top position usually determines the current trend direction.
It’s crucial to note that false signals can occur in choppy markets. To mitigate this issue, increase the number of periods used in the calculation without compromising its accuracy. For example, 25-period VI+ and VI- settings may be more effective than a 14-period setting.
In conclusion, the vortex indicator is an essential tool for traders looking to spot trend reversals and confirm current trends using two lines, VI+ and VI-. By following the calculation methodology, you’ll be on your way to effectively implementing this powerful tool into your investment strategy.
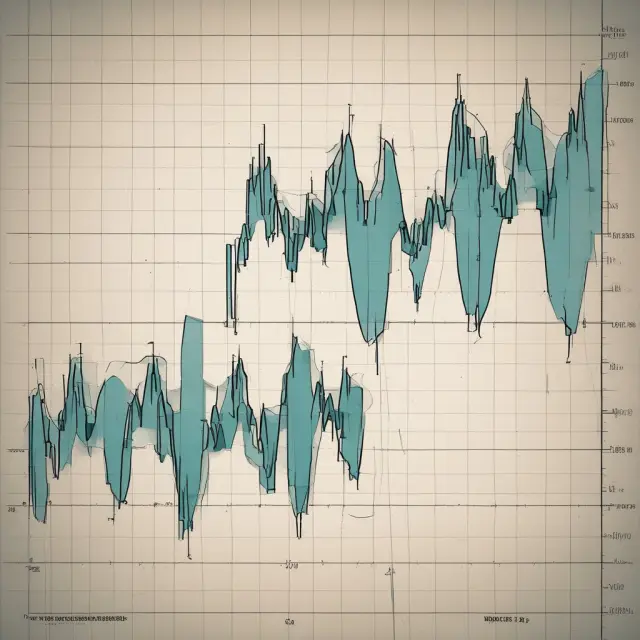
Uptrend vs. Downtrend Signals
The vortex indicator (VI) can help traders identify both uptrends and downtrends by analyzing the relationship between two lines – VI+ and VI-. Uptrend signals, also known as buy signals, occur when the VI+ line crosses above the VI- line. Conversely, downtrend signals, or sell signals, are generated when the VI- line crosses above the VI+ line. In this section, we will delve deeper into the interpretation of these signals and their implications for traders.
Uptrend Signals (Buy Signals)
An uptrend signal is a bullish sign that indicates the asset’s price is increasing and may continue to do so in the near future. This buy signal can be identified when the VI+ line crosses above the VI- line. At this point, the VI+ line takes precedence over the VI-, indicating that the uptrend has resumed or begun anew.
Consider a hypothetical scenario where an investor notices the VI- line crossing below the VI+ line in their charting software. They may decide to wait for a confirmation of this signal through a crossover before making a buy decision. After a few periods, the VI+ line eventually crosses back above the VI-, confirming the uptrend and providing an entry point for the investor.
Downtrend Signals (Sell Signals)
A downtrend signal is a bearish sign that suggests the asset’s price is decreasing and may continue to do so in the near future. This sell signal can be identified when the VI- line crosses above the VI+ line. At this point, the VI- line takes precedence over the VI+ line, indicating that the downtrend has resumed or begun anew.
For instance, imagine an investor observing a chart where the VI- line crosses above the VI+ line. They might wait for a confirmation of this signal by looking for other indicators or chart patterns to corroborate the downturn before making a sell decision. Once the VI- line maintains its position above the VI+ line, it provides an entry point for the investor to capitalize on the bearish trend.
The vortex indicator’s signals can be especially useful when combined with other technical analysis tools and patterns to confirm trends and identify potential reversals. It is important to note that no single indicator offers a guarantee of profitable trades, and traders should use VI alongside other indicators and fundamental analysis for a comprehensive understanding of the market conditions.

Software Integration and Usage
The Vortex Indicator (VI), a popular tool used by traders to identify potential trend reversals, has been integrated into various technical analysis software programs due to its ease of use and effectiveness. This indicator consists of two lines—a uptrend line (VI+) and a downtrend line (VI-)—which can be easily visualized below a candlestick chart. The lines are commonly colored green for the uptrend and red for the downtrend, making it easy to distinguish between them.
The calculations behind the Vortex Indicator involve determining true range and then calculating uptrend movement (VM+) and downtrend movement (VM-) over a specified period. The next step involves dividing these values by the sum of the true ranges for that particular period to derive the VI+ and VI- lines. This process is repeated daily, with the most recent calculations forming the current VI+ and VI- lines.
While the traditional application of the Vortex Indicator can be effective in determining trend reversals, it may yield false signals when price action is volatile or choppy. To mitigate this issue, traders can increase the length of the period used in the calculation to provide a more stable representation of the trends. For example, instead of using the standard 14-day period, one might consider increasing it to 25 days to generate more reliable signals.
Traders often employ the Vortex Indicator alongside other trend reversal patterns to gain a comprehensive understanding of the market conditions and to confirm potential signals. The VI+ and VI- lines can be displayed below a candlestick chart, offering visual confirmation when they cross or change positions, indicating potential shifts in the underlying trend.
In summary, the Vortex Indicator is an essential tool for identifying trend reversals that can be easily integrated into various technical analysis software programs. By understanding how to interpret this indicator’s lines and signals, traders can make more informed decisions when navigating complex market conditions.

Advantages and Disadvantages of Using VI
The Vortex Indicator (VI), with its unique methodology for displaying buy and sell signals, has garnered significant attention from professional investors and traders. This indicator, developed by Etienne Botes and Douglas Siepman in 2009, offers a distinct approach to identifying trend reversals and confirming ongoing trends. Incorporating the Vortex Indicator into your investment strategy comes with both advantages and disadvantages that are essential for understanding before implementation.
Advantages of Using VI
- Clear Signal Direction: The VI indicator’s two lines – VI+ (buy signal) and VI- (sell signal) – clearly indicate whether the security is in an uptrend or downtrend, making it simple to follow for traders.
- Effective Confirmation Tool: By using VI lines in conjunction with other trend reversal patterns, it can provide enhanced confidence in confirming trend signals and potential entry points.
- Adaptability: The Vortex Indicator is widely available on most popular charting platforms and can be used across various timeframes, providing flexibility for traders to implement it within their preferred trading style.
Disadvantages of Using VI
- Complex Calculation: The calculation process involves determining the true range, uptrend and downtrend movement, and a chosen parameter length (n). This complex nature can make it less accessible for some traders who prefer simpler indicators.
- False Signals in Choppy Markets: In fast-paced or volatile markets, VI+ and VI- lines may generate false signals due to price swings. Increasing the parameter length (n) is a potential remedy to minimize such occurrences. However, this adjustment can result in delayed entry points for trends that could have already started.
- Limited Scope: The Vortex Indicator only provides information on trend direction; it does not provide insight into momentum or volatility, which may be critical factors for traders focusing on risk management and exit strategies.
- Combining Multiple Indicators: Given the potential for false signals in volatile markets, some investors prefer to incorporate the Vortex Indicator alongside other indicators, further complicating their chart analysis and interpretation process.
In conclusion, understanding the advantages and disadvantages of using the Vortex Indicator can help professional investors make informed decisions when implementing this indicator into their trading strategy. The clear signal direction, effective confirmation tool, and adaptability are attractive benefits that can contribute to successful trend reversal identification. However, the complex calculation process, potential for false signals in choppy markets, limited scope, and need to combine multiple indicators may deter some traders from using it. As always, careful consideration of an indicator’s strengths and weaknesses is essential before integrating it into your investment approach.

Conclusion: The Role of the Vortex Indicator in Trend Reversal Analysis
The vortex indicator (VI), developed by Etienne Botes and Douglas Siepman, has become a popular tool among investors seeking to identify trend reversals effectively. With its unique calculation methodology, this powerful technical analysis indicator can help traders confirm trends and pinpoint potential reversals.
To calculate the VI, true range is used in conjunction with uptrend (VM+) and downtrend (VM-) movements within a selected parameter length. The calculation process includes determining the sum of true ranges, VM+, and VM- over the specified period. Based on these values, VI+ and VI- trendlines are generated to provide an insight into current and potential trend reversals.
The traditional application of using VI+ and VI- crossovers can yield false trade signals during choppy market conditions. By increasing the number of periods used in the indicator, such as employing a 25-period length instead of the common 14-day setting, traders may be able to minimize these false signals.
The vortex indicator is particularly useful when combined with other reversal trend patterns, providing traders with enhanced confirmation of trend reversals. This technical analysis tool is widely available in most software programs used for charting financial securities.
It is important to note that the VI+ and VI- lines are displayed below a candlestick chart on their own axis. A buy or uptrend signal occurs when VI+ crosses above VI-, while a sell or downtrend signal occurs when VI- crosses above VI+, positioning it above its counterpart. The dominant line in the upper position generally dictates whether a security is experiencing an uptrend or downtrend.
In summary, the vortex indicator plays a crucial role in trend reversal analysis by offering traders valuable insights into potential changes in market trends and confirming current trends. By understanding the calculation methodology and effective usage of this indicator, investors can make informed decisions when entering and exiting trades.

FAQs about the Vortex Indicator
1. What is the Vortex Indicator (VI)? The Vortex Indicator (VI) is a technical analysis tool composed of two lines, VI+ and VI-, which are used to identify trend reversals by plotting their relationship with price movements on a chart. It was introduced by Etienne Botes and Douglas Siepman in 2009.
2. How does the Vortex Indicator calculate its trendlines? The indicator’s calculation involves determining True Range, Uptrend Movement (VM+), and Downtrend Movement (VM-). Then, the VI+ and VI- lines are calculated based on these components.
3. What is the true range in the context of the Vortex Indicator? The true range measures the greatest of three values: the current high minus the current low, the absolute value of the difference between the current high and the previous close, or the absolute difference between the current low and the previous close.
4. Can I change the length of the parameter (n) used in calculating VI+ and VI-? Yes, you can adjust the number of periods used in the calculation process. A common choice is to use between 14 and 30 days.
5. What is a false signal in the context of the Vortex Indicator? False signals occur when the VI lines provide incorrect information about the trend direction. In choppy markets, false signals can lead to a significant number of erroneous trades. To reduce the impact of these false signals, consider increasing the number of periods used in the calculation process.
6. How is the Vortex Indicator used in conjunction with other technical analysis tools? The vortex indicator is often used alongside other trend reversal patterns to validate and strengthen potential trend reversals. By combining multiple indicators, traders can make more informed decisions based on a broader range of data.
7. Is the Vortex Indicator available in popular technical analysis software programs? Yes, it’s a widely used indicator that is integrated into various platforms for stock analysis and other financial markets. Users can access it directly from their preferred software to apply the indicator to their trading strategies.
 Next entry · No. 5,547Vostro Accounts in Correspondent Banking: Understanding Your Account as an Agent or Intermediary
See also
-
 No. 5,071
09 Aug 2025
20 min
Understanding Trends in Finance: Uptrends, Downtrends, and Identification Techniques
Market Trends
No. 5,071
09 Aug 2025
20 min
Understanding Trends in Finance: Uptrends, Downtrends, and Identification Techniques
Market Trends -
 No. 5,913
18 Oct 2025
21 min
Mastering the Zig Zag Indicator for Trend Identification and Filtering Noise in Finance
Financial Tools
No. 5,913
18 Oct 2025
21 min
Mastering the Zig Zag Indicator for Trend Identification and Filtering Noise in Finance
Financial Tools -
 No. 5,518
15 Sep 2025
22 min
Understanding Volatility Ratios: A Technical Measure to Identify Price Patterns and Breakouts
Financial Tools
No. 5,518
15 Sep 2025
22 min
Understanding Volatility Ratios: A Technical Measure to Identify Price Patterns and Breakouts
Financial Tools -
 No. 4,930
28 Jul 2025
18 min
The Tenkan-Sen (Conversion Line): Understanding This Fastest Moving Indicator in the Ichimoko Cloud
Financial Tools
No. 4,930
28 Jul 2025
18 min
The Tenkan-Sen (Conversion Line): Understanding This Fastest Moving Indicator in the Ichimoko Cloud
Financial Tools -
 No. 3,896
05 May 2025
21 min
Understanding the Parabolic SAR Indicator: Identifying Trends and Reversals in Finance
Financial Tools
No. 3,896
05 May 2025
21 min
Understanding the Parabolic SAR Indicator: Identifying Trends and Reversals in Finance
Financial Tools -
 No. 5,774
06 Oct 2025
20 min
A Comprehensive Guide to Understanding and Utilizing Worden Stochastics in Finance and Investment
Business Finance
No. 5,774
06 Oct 2025
20 min
A Comprehensive Guide to Understanding and Utilizing Worden Stochastics in Finance and Investment
Business Finance