Understanding Volume in Finance and Investment: Significance, Technical Analysis, and Market Liquidity

Understand volume in finance and investment through its importance, calculation, impact on technical analysis, market activity and liquidity.
What is Volume?
Volume, a critical term for investors, represents the total number of shares or contracts exchanged between buyers and sellers in financial markets over a defined period. It acts as a barometer of market activity, providing insights into liquidity, order execution, and market sentiment.
For instance, consider stock trading volume. This figure denotes the number of shares traded for a particular security daily. The significance of volume lies in its ability to influence price movements and confirm trends. Greater volumes signify higher liquidity levels, enabling traders and investors to execute larger orders more efficiently. Conversely, lower volumes indicate less active markets or thinly traded securities where large transactions may significantly impact the price.
Calculating volume can be done through various methods: reported volume, estimated volume based on tick data, and net new money inflows into exchange-traded funds (ETFs) and other investment vehicles. Exchanges report volume estimates throughout the trading day and publish final figures at the end of each session. However, these reports may not capture the entire trading activity due to complex trades or omitted data.
Volume plays a vital role in technical analysis, providing essential confirmation for trend continuation or reversals. A surge in volume during an uptrend can signal a strong bullish movement, while a drop in volume during a downtrend may indicate weakness. In essence, volume serves as an additional tool for gauging market conditions and potential price movements.
In the context of options trading, understanding volume is crucial to assessing open interest and implied volatility. High option volumes suggest increased demand or expectation of potential price swings, which could impact the underlying stock’s price in the future.
This article focuses on deciphering the meaning and significance of volume in various financial markets while highlighting its role in technical analysis, market liquidity, and overall trading strategy. So, join us as we delve deeper into the world of volume!

Calculating and Reporting Volume
Volume, which refers to the total number of shares or contracts exchanged during a specific period, is a crucial metric for gauging market activity and liquidity levels in finance and investment. This section will explain how volume is calculated, reported, and estimated, as well as discuss tick volume’s role as a surrogate for trade volume.
Volume calculation: Each transaction that occurs between a buyer and a seller contributes to the total volume count for that security. Trades are recorded whenever a buyer agrees to purchase what a seller is offering at a certain price. The volume of transactions is tracked by every market exchange and reported either free or on a subscription basis throughout the trading day. Since prices tend to change more frequently with high volumes, tick volume—the number of price changes in a contract—can also be used as a proxy for trade volume.
Reporting: Volume figures are often reported hourly during the current trading day, while final actual figures are reported the next day. This discrepancy is due to the fact that volume reporting is an estimate based on real-time data. The tick volume provides immediate insight into the market’s activity but may not accurately reflect the total number of shares traded since each transaction might involve multiple price changes.
Market Liquidity and Significance: A higher trading volume indicates a more liquid market, with better order execution possibilities for buyers and sellers. Trading volume tends to be higher near market openings and closings, as well as on Mondays and Fridays, while it tends to decrease at lunchtime and before holidays. In uncertain markets, futures trading volume increases, driving up options and contracts’ trading volumes. Institutional investors can use high trading volumes as a measure of a security’s popularity or market interest.
In conclusion, understanding volume is vital for investors seeking insight into market activity and liquidity levels. By calculating, reporting, and interpreting trading volume effectively, investors can make informed decisions regarding their investment strategies.
Volume in Technical Analysis
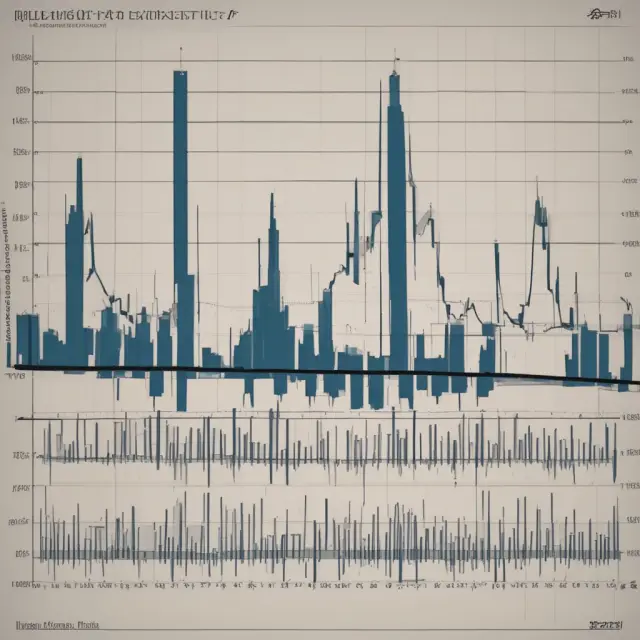
Understanding volume as a crucial indicator in technical analysis is essential for determining entry and exit price points for securities. It offers insights into market activity and liquidity, helping analysts make informed decisions. Volume is calculated by recording the number of shares or contracts traded over a specified period. Trading volume data can be obtained from various sources throughout the trading day, with hourly reports being the most common.
In technical analysis, investors focus on measuring the significance of market moves through volume levels. A higher volume during a price movement indicates stronger momentum and is considered more significant than a similar move with lower volume. Conversely, low volumes indicate weaker momentum. The importance of volume lies in its ability to confirm trends and provide insight into potential reversals or breaks in support or resistance levels.
One technique used by traders and analysts is examining bar charts to identify trends in volume. High volumes at a particular price level suggest strong buying or selling interest, making it an essential confirmation tool for price movements. For instance, if prices reverse at a level of support and are accompanied by high buying volume, it signifies a strong reversal. Alternatively, if prices break through a resistance level with high selling volume, it implies a significant price shift.
Another use case for volume analysis is in understanding the role of different market participants, such as high-frequency traders (HFTs) and index funds, in driving market volumes. In recent years, passive investment strategies like ETFs and quantitative accounts have become major contributors to trading volume statistics in US markets. According to a 2017 JPMorgan analysis, these types of investors accounted for approximately 60% of overall trading volumes, while fundamental discretionary traders comprised only 10%. Understanding the role of various market participants and their impact on trading volumes is crucial in making informed decisions based on volume analysis.

Influence of Volume on Market Activity
Volume plays an essential role in market activity and liquidity, acting as a barometer for the ebb and flow of investor interest. The significance of volume is underpinned by its impact on both individual securities and the broader market as a whole.
Firstly, high volumes provide important context when assessing price movements, particularly for technical analysts seeking entry and exit points. As mentioned previously, if a stock makes large moves during a given period, the significance of that movement is evaluated based on the volume during that time. The higher the volume, the more substantial the move is considered to be, as it indicates greater conviction among traders and investors. Conversely, low volumes may indicate weaker price movements or even lackluster market interest.
Furthermore, volume helps gauge overall liquidity within a market, which can significantly impact order execution and risk management for both individual and institutional investors. Markets with higher volumes facilitate more efficient price discovery, ensuring buyers and sellers are able to find each other more easily. High trading volumes also reduce the potential for widening bid-ask spreads – the difference between the highest price a buyer is willing to pay (bid) and the lowest price a seller is willing to accept (ask). This can be of particular importance for institutional investors looking to execute large orders without significantly impacting the market.
High-frequency traders (HFT) and index funds have become significant contributors to trading volumes in modern markets, accounting for approximately 60% of overall volumes according to a JPMorgan analysis. These automated strategies employ sophisticated algorithms that analyze vast amounts of data in real-time, enabling them to execute trades at high speeds and volumes. This increased activity can lead to more efficient price discovery and tighter bid-ask spreads, benefiting all market participants.
However, it is essential to acknowledge the potential downside of heavy reliance on automated trading strategies: they can sometimes create volatility and exacerbate price swings. In some cases, this may lead to increased risk for individual investors and potentially adverse market conditions. As such, understanding the impact of volume on market activity is crucial for navigating today’s complex financial landscape.

Volume Indicators in Technical Analysis
In the realm of technical analysis, volume plays a pivotal role as it helps identify significant entry and exit points for investors by providing insights into market strength and price movements. Two popular volume indicators widely used are moving averages of volume and On-Balance Volume (OBV).
Moving Averages of Volume
The moving average of volume is a lagging indicator, calculated by applying various smoothing techniques to the trading volume data points over a specified period. This method provides a clear picture of long-term trends in volume. For instance, the 14-day moving average of volume is derived by summing up the daily trading volumes for the past 14 days and then dividing this total by 14. The result represents an average volume level over the last two weeks. Traders often look at moving averages of volume to assess bullish or bearish market conditions, as well as to determine potential reversal patterns.
On-Balance Volume (OBV)
On-Balance Volume (OBV) is a cumulative volume indicator that tracks the net flow of volume from up volumes (when buyers are pushing prices higher) and down volumes (when sellers are pushing prices lower). By calculating the total buying volume over selling volume in an uptrend and vice versa, OBV provides valuable insights into the underlying trend’s strength. When there is more buying volume than selling volume during a trend, the indicator continues to rise, suggesting that the trend will continue. Conversely, if the selling volume outpaces buying volume, the indicator starts to decline, indicating weakness in the current trend.
Volume Trends and Implications
Understanding trends in trading volumes can offer significant insights into investor sentiment and overall market conditions. For example, a prolonged increase in trading volume could signal an upcoming trend reversal or a significant shift in investor sentiment towards a particular asset. Volume patterns can also be used to confirm price movements and identify potential breakouts or breakdowns in support or resistance levels.
The use of volume indicators like moving averages of volume and On-Balance Volume (OBV) not only adds depth but also enhances the overall value of technical analysis, providing essential insights into market dynamics and investor behavior that can help investors make informed decisions on their investments.

Volume as a Confirmation Tool
Volume plays a pivotal role in confirming price movements, reversals, and breaks in support or resistance. Technical traders use volume to determine entry and exit points based on market strength and significance. The more substantial the volume during a price move, the more powerful its impact on the security’s price direction. This section explores how volume acts as a confirmation tool in various market scenarios.
Volume in Confirming Price Movements
Volume serves to strengthen the conviction of traders when evaluating the significance of price movements. A substantial increase or decrease in volume during a price movement suggests that the move is more likely to be credible and sustainable, compared to one with insignificant volume. For instance, a large-volume breakout above resistance or a significant drop in volume following a sharp decline indicates that the price direction may persist.
Volume in Confirming Reversals
Reversal patterns rely on changes in trading volumes to confirm potential trend reversals. A strong increase in buying volume during a downtrend, or an unexpected surge of selling volume during an uptrend can signal a potential reversal. By analyzing historical charts and studying price action alongside volume data, traders may use these instances as entry points for their positions.
Volume in Confirming Breaks in Support/Resistance
Volume is also important in confirming breaks below support or above resistance levels. If a security’s price breaks through a significant support or resistance level and is accompanied by high volume, this confirmation can provide added confidence to traders looking to capitalize on the price movement. Conversely, if a break fails to generate significant volume, it may indicate a potential false signal, necessitating caution from traders.
Volume in Trend Analysis
In trend analysis, volume aids traders in understanding the underlying strength of an existing trend or a potential developing trend. A strong and consistent increase in volume during an uptrend signifies that buying pressure is growing, indicating the continuation of the trend. Conversely, declining volume during a downtrend suggests that sellers are losing interest, which could signal a reversal or weakening trend.
Volume in Market Sentiment
Volume can also provide insights into overall market sentiment by reflecting the level of buying and selling pressure present. For instance, high trading volumes on both the buy and sell sides could indicate uncertainty in the market, while lopsided volume between the two sides may suggest a potential trend shift or directional move. By closely monitoring volume trends alongside other technical indicators, traders can develop a more comprehensive understanding of market dynamics and make informed decisions based on this information.
In conclusion, volume is an essential tool for confirming price movements, reversals, and breaks in support or resistance levels. Its analysis provides valuable insights into the strength and direction of market trends while offering clues about potential shifts in investor sentiment. By incorporating volume data into their trading strategies, traders can improve their overall understanding of the markets and make more informed investment decisions.

Implications of Volume for Institutional Investors
Understanding volume is crucial for institutional investors looking to execute large orders without causing significant market impact or volatility. Large orders, if executed in a short period, can influence prices significantly and result in unfavorable execution prices. Therefore, institutions often rely on tools like the order book, limit orders, and market makers to manage their trades effectively.
Volume plays a vital role in these strategies by providing insights into market liquidity and potential price movements. Institutional investors utilize volume patterns and indicators to make informed decisions about when to enter or exit a position based on the underlying supply and demand dynamics of the security.
For instance, a large order entering the market at a high-volume area may find more counterparties interested in executing trades, ensuring better price discovery and minimizing slippage. Conversely, attempting a large trade in low volume conditions could lead to wider spreads and adverse price movements.
Institutions also employ various volume indicators like moving averages of volume (MAVg), On-Balance Volume (OBV), or Chaikin Money Flow (CMF) to gauge market sentiment and potential reversals. These indicators can help identify important trend reversal signals, allowing institutions to execute their trades at favorable prices.
Moreover, understanding volume patterns helps institutional investors assess the potential risk of price movements and adjust trading strategies accordingly. For example, significant increases in buying or selling volume can indicate strong market sentiment and potentially lead to large price swings. By monitoring these trends, institutions can position themselves for profitable opportunities while minimizing their risks.
In conclusion, understanding volume and its significance in finance and investment is essential for both individual investors and institutional traders alike. Volume offers valuable insights into market activity, liquidity, and potential price movements that can help investors make informed decisions. By employing various tools and indicators, investors can effectively manage their trades and adapt to changing market conditions.
Volume Trends and Market Conditions
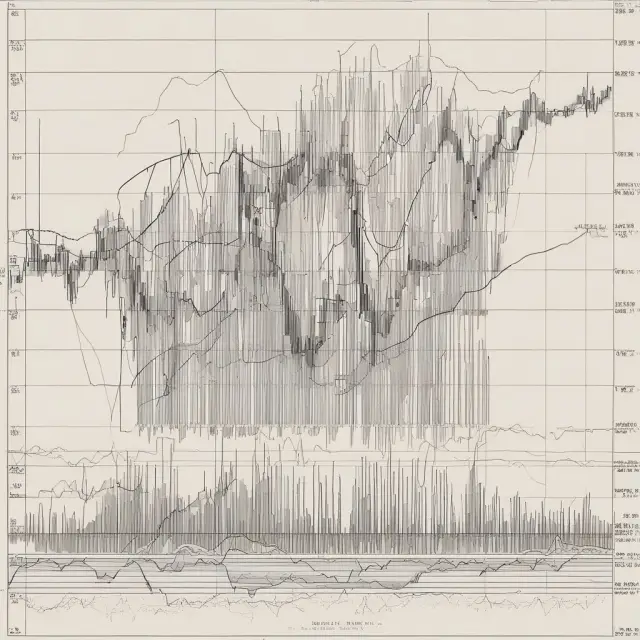
Understanding the trend in volume can help investors decipher market conditions, investor sentiment, and overall activity levels within the financial markets. Volume is a valuable tool for measuring trading intensity and liquidity. As previously discussed, volume represents the number of shares or contracts traded during a specific time frame. Trends in trading volumes can provide important insights regarding market sentiment and liquidity.
In bullish markets, when investor optimism is high, there tends to be increased buying interest, leading to higher trading volumes. On the other hand, bearish markets are characterized by selling pressure and lower trading volumes. Trends in volume may also reflect changes in market dynamics, such as shifts in investor sentiment or regulatory changes.
For instance, an increase in trading volume for a particular stock or index can signal a significant event or news development that is driving market activity. Conversely, decreased trading volume could indicate a lack of interest or uncertainty in the market. Volume trends are closely monitored by both short-term and long-term traders to assess the potential impact on their investment strategies.
Furthermore, high volumes can lead to more efficient price discovery and better risk management for investors, as they allow for larger orders to be executed with minimal price impact. Conversely, low trading volumes may result in wider bid-ask spreads and increased price volatility due to the lack of liquidity.
Investors may also observe volume trends across different market segments or asset classes to gauge relative market strength or weakness. For example, if the technology sector experiences significantly higher trading volumes compared to other sectors, it could suggest that investors are favoring tech stocks over other sectors based on current market conditions.
It is essential for traders and investors to understand the importance of volume in assessing market trends and conditions. By closely monitoring volume levels, they can make informed decisions about buying or selling securities and adjust their investment strategies accordingly.

Volume and Liquidity: The Connection
Volume plays a significant role in determining market liquidity, which is crucial for efficient price discovery and effective risk management. In finance and investment, volume refers to the number of shares or contracts traded during a specified period. Higher trading volumes indicate more liquid markets where transactions are easily executed at desired prices due to a larger pool of available buyers and sellers.
Calculating and reporting trading volumes can be done through various methods. One transaction between a buyer and seller contributes to the total volume count for a security. Each market exchange provides daily reported trade volumes, although these figures are estimates and may not match final actual figures. Volume is also measured by tick volume, or the number of price changes, which acts as a proxy when actual trade volumes aren’t readily available.
Volume significantly impacts market activity and liquidity in several ways:
- Market efficiency: Higher trading volumes facilitate faster price discovery through more efficient matching between buyers and sellers, resulting in accurate pricing and reduced bid-ask spreads.
- Risk management: Liquid markets offer better risk management opportunities for investors as they can easily enter or exit positions due to the availability of potential counterparties.
- High-frequency trading (HFT) and institutional investors: High-frequency traders (HFTs) and large institutional investors contribute significantly to overall trading volumes, influencing market liquidity through their trading algorithms and sizeable orders.
- Technical analysis: Volume is a crucial component of technical analysis as it helps investors determine the significance of price movements by providing insights into buying and selling pressure.
- Market sentiment: Changes in trading volumes can reflect shifts in investor sentiment, allowing traders to make informed decisions based on market conditions.
In conclusion, volume plays an essential role in understanding market liquidity and its impact on efficient price discovery, risk management, and overall market activity. By closely examining trading volumes and identifying trends, investors can make more informed decisions and improve their investment strategies.

FAQs on Volume in Finance and Investment
Question: What is trading volume and how does it differ from tick volume?
Answer: Trading volume refers to the number of shares, bonds or contracts traded over a specific period. Tick volume, also known as tick data or tick stream, represents the number of price changes. Although closely related, tick volume and trading volume are not the same, as a single trade may involve multiple ticks while some trades may only result in one tick change.
Question: What is the significance of volume in finance?
Answer: Volume plays an essential role in measuring market activity and liquidity. It indicates the number of securities transacted between buyers and sellers during a given time frame, providing insights into investor demand and supply levels, as well as the overall health and strength of a security or market. In technical analysis, volume is used to confirm price trends and identify potential reversals.
Question: How is volume reported?
Answer: Volume data is typically reported hourly during the trading day and daily after markets close. It is often sourced from stock exchanges, financial databases, or other market data providers. In some cases, volume figures may be estimated based on tick data.
Question: What affects trading volumes?
Answer: Trading volumes can be influenced by a range of factors including economic conditions, market sentiment, news events, and the presence of large institutional orders that may impact market liquidity. Additionally, certain times of day or week may experience higher volumes due to increased investor interest.
Question: How is volume calculated?
Answer: Volume is calculated by adding up the number of securities traded over a given period (e.g., one day). This can be determined from exchange records, trade confirmations, or other sources of market data. The trading activity represented by this number provides insights into the level of demand and supply for a security, which can influence its price trend.
Question: What is the importance of volume in technical analysis?
Answer: In technical analysis, volume is used to validate trend reversals, confirm entry or exit points, and evaluate the strength of trends. By examining volume patterns, traders can assess the conviction behind price movements and better understand the overall health of a security or market.
 Next entry · No. 5,527Understanding Volume of Trade: A Key Metric for Institutional Investors
See also
-
 No. 5,661
27 Sep 2025
17 min
Understanding the Power of Wedge Patterns in Technical Analysis
Finance Policy
No. 5,661
27 Sep 2025
17 min
Understanding the Power of Wedge Patterns in Technical Analysis
Finance Policy -
 No. 5,340
31 Aug 2025
18 min
Upside/Downside Ratio: A Powerful Market Breadth Indicator for Investors
Business Strategy
No. 5,340
31 Aug 2025
18 min
Upside/Downside Ratio: A Powerful Market Breadth Indicator for Investors
Business Strategy -
 No. 5,524
16 Sep 2025
17 min
Understanding Volume Analysis: A Key Indicator in Technical Trading
Financial Data Analysis
No. 5,524
16 Sep 2025
17 min
Understanding Volume Analysis: A Key Indicator in Technical Trading
Financial Data Analysis -
 No. 3,600
11 Apr 2025
21 min
Understanding NYSE Arca: A Comprehensive Guide for Institutional Investors
Business Finance
No. 3,600
11 Apr 2025
21 min
Understanding NYSE Arca: A Comprehensive Guide for Institutional Investors
Business Finance -
 No. 3,389
24 Mar 2025
19 min
Understanding Negative Amortization: Risks and Considerations for Institutional Investors
Mortgage
No. 3,389
24 Mar 2025
19 min
Understanding Negative Amortization: Risks and Considerations for Institutional Investors
Mortgage -
 No. 5,922
18 Oct 2025
18 min
Understanding the Zone of Resistance: Technical Analysis for Institutional Investors
Financial Data Analysis
No. 5,922
18 Oct 2025
18 min
Understanding the Zone of Resistance: Technical Analysis for Institutional Investors
Financial Data Analysis