Understanding the Genuine Progress Indicator: A Better Metric for Economic Growth?
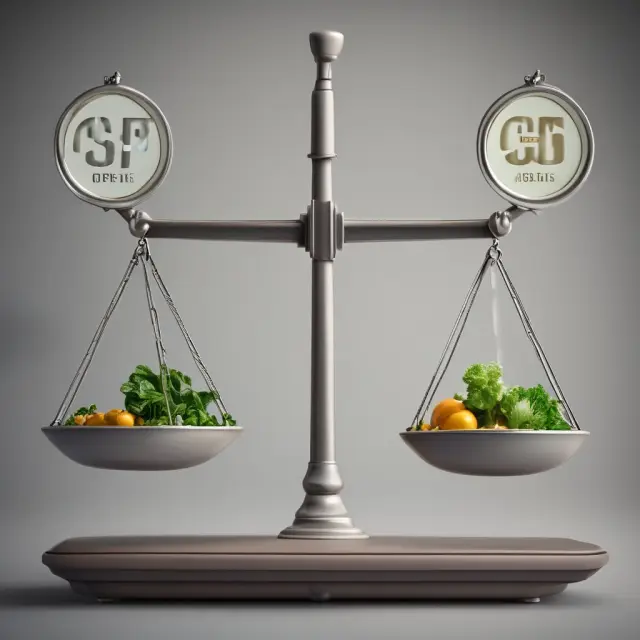
Explore the Genuine Progress Indicator (GPI) - an alternative economic metric accounting for externalities and societal contributions. Understand its…
Introduction to the Genuine Progress Indicator (GPI)
The Genuine Progress Indicator (GPI) is a metric used to measure a nation’s economic growth beyond the scope of traditional measures such as the Gross Domestic Product (GDP). Developed in response to limitations with the widely-used GDP indicator, the GPI takes into account both positive and negative impacts of economic activity on the environment and society. This section will delve deeper into the history, definition, and components of the Genuine Progress Indicator as an alternative measure for assessing a nation’s economic prosperity.
History and Background
The concept of the Genuine Progress Indicator was born out of concerns that the Gross Domestic Product (GDP), which measures the total value of goods and services produced in an economy, was insufficient for evaluating true economic progress. While GDP is a valuable tool for measuring economic output, it fails to consider negative consequences associated with growth such as environmental degradation, resource depletion, and social issues. In response to these limitations, the genuine progress indicator (GPI) was developed in the mid-1990s by Clifford Cobb, Ted Halstead, and Jonathan Rowe from the U.S.-based organization Redefining Progress. This metric was designed to encompass a more comprehensive assessment of economic growth and well-being, incorporating both economic indicators as well as social and environmental factors.
What Is the Genuine Progress Indicator?
The genuine progress indicator (GPI) is an economic metric that seeks to provide a more holistic view of a nation’s economic growth by accounting for externalities like pollution, resource depletion, and other societal costs. The GPI measures the net progress towards sustainable well-being for current and future generations. It differs significantly from GDP in that it subtracts negative impacts on the environment and society to determine overall progress. In essence, GPI presents a more accurate picture of a nation’s overall economic health by accounting for both positive and negative aspects of growth.
How Does the GPI Measure Economic Growth?
The genuine progress indicator (GPI) measures economic growth by calculating the net gains from economic activity, after taking into account the costs associated with externalities such as environmental degradation, resource depletion, crime, and other societal issues. In doing so, it provides a more accurate representation of economic welfare than the Gross Domestic Product (GDP). By accounting for these negative impacts, the GPI offers a more comprehensive understanding of a nation’s overall progress towards sustainable well-being.
Stay tuned for upcoming sections on the components of the genuine progress indicator and how it differs from the Gross Domestic Product.
What Is the Genuine Progress Indicator?
The Genuine Progress Indicator (GPI), also known as the genuine progress index, is an alternative economic metric that aims to measure a nation’s overall well-being beyond its monetary value or Gross Domestic Product (GDP) growth. Developed in response to the limitations of GDP, which fails to account for various externalities and social costs, the GPI takes a more holistic approach by considering both positive and negative economic factors.
The concept of the Genuine Progress Indicator was introduced in 1995 by Clifford Cobb, Ted Halstead, and Jonathan Rowe under the U.S.-based organization Redefining Progress. The metric is based on the idea that economic progress should be measured not just by financial gains but also by its impact on the environment and society as a whole. This innovative approach provides a more comprehensive view of a country’s overall prosperity and sustainability.
The GPI takes into account 26 key indicators divided into three categories: social, economic, and environmental. By accounting for factors like personal consumption, capital growth, volunteerism, crime rates, pollution, climate change, natural resource depletion, and more, the Genuine Progress Indicator offers a more balanced and accurate representation of an economy’s health compared to the traditional focus on monetary growth alone.
The calculation of the Genuine Progress Indicator involves subtracting negative impacts from positive ones to determine net progress towards sustainable economic growth. The formula for GPI is as follows:
GPI = Adjusted Net National Product (ANNP) + Value of Household Production + Social and Environmental Contributions – Depreciation and Consumption of Nonrenewable Resources – Correction for Changes in Net Financial Assets
The Genuine Progress Indicator has received mixed reactions from economists, policymakers, and the general public. While some view it as a more comprehensive measure of economic well-being that considers the true cost of production and consumption, others argue that its subjectivity and inconsistencies make it less effective in comparison to the widely adopted Gross Domestic Product. Nonetheless, the ongoing research and development of the GPI continue to shed light on the potential benefits of a more holistic approach towards assessing economic progress.
In the following sections, we will discuss the history, components, and advantages/disadvantages of the Genuine Progress Indicator, as well as its comparison with GDP. By examining these aspects, we aim to provide you with a clear understanding of this alternative economic metric and its relevance to your investment strategies.

How Does the GPI Measure Economic Growth?
The genuine progress indicator (GPI) represents an attempt to measure economic growth more comprehensively than traditional measures like gross domestic product (GDP). While GDP is a widely used metric for measuring economic growth, it has significant limitations, particularly in its failure to account for externalities and the impact on society. The Genuine Progress Indicator was developed as an alternative metric to address these shortcomings.
One of the primary ways that the GPI measures economic growth differently from GDP is by accounting for externalities. Externalities are costs or benefits not reflected in market prices but still impact economic activity. For example, pollution and crime negatively affect both individuals and society as a whole, leading to significant costs that are often not factored into GDP calculations. By including these externalities, the GPI provides a more complete picture of the true impact of economic growth on a nation’s overall progress.
Moreover, the GPI recognizes the importance of societal contributions beyond market transactions. These contributions include volunteer work, household labor, and education – all critical aspects of a thriving society. By incorporating these factors into the calculation, the GPI can offer a more balanced assessment of economic growth that goes beyond mere financial measures.
The Genuine Progress Indicator was developed in the late 1990s by Redefining Progress, an organization advocating for sustainable economics. Since then, it has gained recognition as a valuable tool for assessing the broader impact of economic activity on society and the environment. While still not widely adopted as a standard metric, the GPI continues to garner interest from scholars, policymakers, and investors seeking a more holistic understanding of economic progress.
In the following sections, we will delve deeper into the specific components of the Genuine Progress Indicator and explore its history and applications. By understanding how this alternative metric measures economic growth, we can gain valuable insights into the potential shortcomings of traditional measures like GDP and consider new ways to evaluate the true impact of our economic decisions on society and the environment.

GPI Components: Social, Economic, and Environmental Indicators
The Genuine Progress Indicator (GPI), a metric used as an alternative economic measure to the more popular Gross Domestic Product (GDP), is renowned for its comprehensive approach to measuring economic growth. It not only accounts for economic output but also integrates environmental and social indicators. In this section, we delve deeper into the 26 specific components of GPI, which are grouped into three primary categories: social, economic, and environmental.
Social Indicators
The social indicators in GPI measure various aspects of a society’s well-being that may not be directly captured by economic metrics such as GDP. These indicators cover a wide range of aspects related to education, health, crime, housing, and community engagement:
- Education: The educational attainment levels of a population are crucial for socioeconomic development.
- Health: A healthy population is essential for economic productivity and societal prosperity.
- Crime Rates: Lower crime rates reflect safer communities and greater societal well-being.
- Family Structure: Strong family structures contribute to the stability of society.
- Volunteerism: Voluntary contributions to community efforts are valuable assets that cannot be quantified through economic means.
- Leisure Time: The availability and utilization of leisure time can impact overall well-being.
- Social Support Networks: A robust network of social support enhances societal resilience.
- Environmental Quality: Good environmental quality is essential for the health, happiness, and productivity of a population.
- Subjective Well-Being: This indicator measures an individual’s perception of their overall well-being.
- Cultural Diversity: A diverse cultural landscape fosters creativity and innovation.
- Social Cohesion: High levels of social cohesion contribute to a stable society.
Economic Indicators
The economic indicators in GPI provide a more nuanced view of economic activity than the conventional measure of GDP. These indicators help account for both positive and negative aspects of economic growth:
- Household Debt: Excessive debt can hinder economic progress and lead to financial instability.
- Unemployment Rates: High unemployment rates impede overall economic prosperity.
- Underemployment: Underemployment refers to those working in jobs that do not match their skills or aspirations.
- Income Distribution: A more equitable distribution of income supports a stronger economy and greater societal stability.
- Household Expenditures: Measuring household expenditures helps capture the true economic well-being of a population.
- Wealth: Total wealth in an economy is essential for long-term stability and growth.
- Business Productivity: Efficient businesses contribute to overall economic progress.
- Capital Investment: A robust investment climate fosters innovation and growth.
- Entrepreneurship: New business ventures drive economic dynamism.
Environmental Indicators
The environmental indicators in GPI account for the impact of human activities on the natural world, which is often overlooked in traditional economic measures like GDP:
- Air Quality: Clean air is essential for public health and the environment.
- Water Quality: Good water quality is crucial for maintaining ecosystem health.
- Soil Quality: High-quality soil is vital for agricultural productivity and food security.
- Energy Consumption: The environmental impact of energy consumption must be considered to measure true economic growth.
- Waste Management: Proper waste management is essential for preventing pollution and maintaining a clean environment.
- Natural Resource Depletion: Sustainable resource management is crucial for long-term economic viability.
By integrating these 26 indicators into the GPI framework, policymakers can gain a more comprehensive understanding of their country’s true economic progress and use this knowledge to inform decisions that promote sustainable growth, social well-being, and environmental stewardship.

History and Development of GPI
In the 1930s, economic measures were essential to assessing the economic health of a nation. The Roosevelt administration sought ways to measure national income and output following the Great Depression through questionable data. Simon Kuznets, an economist at the National Bureau of Economic Research (NBER), was commissioned by Congress to develop more suitable economic metrics than those previously used. His report “National Income 1929-1935” introduced the concept of gross domestic product (GDP), which measures a country’s total value of goods and services produced in a specific period. However, Kuznets warned that GDP was not an effective measure for assessing the overall health of a nation, stating that it only measured economic production without considering its environmental or social impact (Redefining Progress, 2005).
Over six decades later, in 1995, U.S.-based organization Redefining Progress recognized the limitations of GDP as an economic measure and built upon Kuznets’s original findings to create a new metric: the genuine progress indicator (GPI) (Redefining Progress, 2005). Clifford Cobb, Ted Halstead, and Jonathan Rowe developed this alternative metric to define a nation’s welfare not only by its economic measures but also by the state of its social, environmental, and human conditions. The GPI is designed to measure genuine progress rather than just economic growth (Redefining Progress, 2005).
The initial version of the Genuine Progress Indicator consisted of 26 indicators that measured various aspects of a nation’s well-being within three categories: social, economic, and environmental (Redefining Progress, 2005). These indicators were chosen based on their relevance to the overall welfare of a country.
However, some inconsistencies existed with the initial GPI calculations due to its broad definition. To address these inconsistencies, two summits were held in 2003 and 2007 to refine the GPI methodology, resulting in the modified GPI 2.0 (Redefining Progress, 2018). The modifications improved accounting processes and replaced antiquated methodologies for a more accurate representation of a nation’s overall economic health.
As of now, select U.S. states and Canada are testing the efficacy of GPI 2.0 to evaluate its potential as an alternative metric for measuring economic progress (Redefining Progress, 2018). Incorporating environmental and social elements into the calculation of economic growth has become increasingly important as the world’s population and resource consumption continue to grow rapidly.
The genuine progress indicator offers a more comprehensive view of economic growth by accounting for externalities and societal contributions that are often overlooked in traditional GDP calculations. This shift from a narrow focus on production and consumption to a broader perspective encompassing social, environmental, and human well-being can lead to better policymaking and decision-making processes at both the national and international levels.
However, critics argue that the GPI is subjective due to the need to assign values to societal contributions and externalities, making it a less effective tool for comparing one economy to another (Redefining Progress, 2018). Despite these challenges, ongoing efforts are being made to refine and improve the methodology of calculating genuine progress indicators to create more accurate and reliable metrics for measuring overall economic well-being.
Comparing GDP and GPI: Pros and Cons
When it comes to measuring economic growth or progress, gross domestic product (GDP) has long been the go-to metric. However, some economists, policymakers, and researchers argue that GDP falls short in providing a complete picture of a nation’s well-being. This is where the Genuine Progress Indicator (GPI) comes into play as an alternative economic metric. In this section, we delve deeper into the comparison between GDP and GPI, discussing their advantages and disadvantages.
Advantages of Gross Domestic Product (GDP):
- Objective Measurement: GDP provides a clear, quantitative measurement of a country’s economic output based on the value of all final goods and services produced within its borders during a given period.
- Consistent and Reliable: Being a well-established metric for more than 80 years, GDP is universally accepted and used as the primary measure of economic performance across countries.
- Easy to Understand: Since GDP is calculated based on the production side of the economy, it is relatively easy to comprehend for people without an extensive background in economics.
- Provides a Basis for Comparisons: GDP allows comparisons between economies, helping determine which countries are growing faster and outpacing their competitors.
- Useful for Policy Analysis: The availability of historical data on GDP makes it a valuable tool for policymakers to assess the impact of fiscal and monetary policies on an economy.
Disadvantages of Gross Domestic Product (GDP):
- Ignores Negative Externalities: GDP fails to account for negative externalities, such as pollution, depletion of natural resources, and other environmental costs associated with economic activity.
- Doesn’t Reflect Distribution of Income: By focusing on production and output, rather than the distribution of income or wealth, GDP does not provide a complete understanding of the overall well-being of a population.
- Ignores Social Contributions: Volunteer work, housework, and education are essential societal contributions, but they don’t result in monetary compensation, meaning they are disregarded by GDP calculations.
- Lacks Sustainability Perspective: GDP does not account for long-term economic sustainability or the potential negative consequences of present actions on future generations.
- Misalignment with Public Preferences: GDP’s focus on production and output may not align with people’s preferences, as it does not reflect their values, priorities, or well-being.
Advantages of the Genuine Progress Indicator (GPI):
- Holistic Perspective: GPI provides a more comprehensive view by accounting for both positive and negative aspects of economic growth. It considers externalities like pollution, environmental degradation, and social factors such as health, education, crime, and volunteer work.
- Sustainability Focused: The Genuine Progress Indicator takes a long-term perspective and emphasizes sustainable economic development that minimizes the negative impact on natural resources and future generations.
- Improves Comparability of Economies: By accounting for similar factors, GPI provides a more accurate and comparable measure of economic progress between countries with varying socioeconomic conditions and environmental challenges.
- Reflects Social Welfare: GPI incorporates social welfare considerations by including the value of unpaid work and other aspects that impact overall societal well-being.
- Better Alignment with Public Preferences: By reflecting a broader range of factors, GPI is more likely to align with public preferences and values regarding economic progress.
Disadvantages of the Genuine Progress Indicator (GPI):
- Complexity and Subjectivity: The calculation of GPI involves many subjective judgments and assumptions about the value of various indicators, leading to potential inconsistencies and inaccuracies.
- Difficulties with Cross-Country Comparisons: The differences in data availability, quality, and methodologies among countries can make it challenging to compare GPIs effectively.
- Limited Adoption: Although GPI has gained traction since its development, it is not as widely accepted or used as GDP by policymakers, investors, and researchers due to its complexity and the lack of standardization.
- Inconsistent Data Collection: The collection and availability of data for certain indicators can be inconsistent, leading to difficulties in accurately calculating GPI values for specific countries or regions.
- Limited Usefulness for Policy Analysis: While GPI offers valuable insights into various aspects of economic growth, it may not be as straightforward or comprehensive a tool for policy analysis as GDP due to its complexity and the challenges associated with cross-country comparisons.
In conclusion, while both GDP and GPI serve essential roles in measuring economic performance and progress, they each have their unique strengths and limitations. Understanding these advantages and disadvantages can help inform policymakers, investors, and researchers when making decisions that impact the long-term sustainability of economies and people’s well-being.

Calculating the Genuine Progress Indicator (GPI)
The genuine progress indicator (GPI) is a valuable alternative metric for measuring economic growth that considers externalities and societal contributions. While Gross Domestic Product (GDP) calculates a country’s total economic output, GPI goes beyond this measure by accounting for the cost of negative consequences associated with economic activity. To calculate the Genuine Progress Indicator (GPI), economists consider multiple factors that contribute to economic growth and subtract those that have negative impacts on society or the environment. In this section, we will explain how to calculate the GPI, providing you with a thorough understanding of this unique economic metric.
GPI: A More Complete Picture of Economic Growth
The genuine progress indicator (GPI) emerged as an alternative measure to GDP in response to its limitations. While GDP offers valuable insights into a country’s economic activity, it fails to account for negative externalities and societal contributions. In contrast, the GPI provides a more holistic view of a nation’s economic progress by factoring in both positive and negative influences on society and the environment.
Components of the Genuine Progress Indicator (GPI)
The genuine progress indicator comprises 26 indicators across three primary categories: social, economic, and environmental. These indicators help economists understand the overall health and well-being of a nation’s economy by taking into account factors that are often overlooked in traditional GDP calculations. Let us explore each category and its corresponding indicators in detail:
1. Social Indicators
Social indicators capture aspects of a society’s quality of life, such as:
– Health status (e.g., mortality rate, life expectancy)
– Education level (e.g., literacy rate, school enrollment)
– Social support networks (e.g., volunteerism, charitable giving)
– Crime rates and incarceration
2. Economic Indicators
Economic indicators focus on production, consumption, and wealth distribution:
– Employment rate and wages
– Household income and disposable income
– Income inequality (e.g., Gini coefficient)
– Consumer spending
3. Environmental Indicators
Environmental indicators help measure the impact of economic activity on the natural world:
– Air pollution levels (e.g., particulate matter, SO2 emissions)
– Water quality (e.g., water use, wastewater treatment)
– Natural resource depletion (e.g., fossil fuels, minerals)
– Climate change impact (e.g., greenhouse gas emissions, sea level rise)
Calculating the GPI: The Formula
To calculate the genuine progress indicator (GPI), economists employ the following formula:
GPI = Cadj + G + W – D – S – E – N
Let us break down each component of the equation to understand its role in the calculation:
– Cadj: This term represents personal consumption adjusted for income distribution, which accounts for the impact of income inequality on overall economic well-being.
– G: Capital growth measures the increase in a nation’s productive capacity over time.
– W: Unconventional contributions to welfare capture societal benefits that are not captured by traditional economic indicators, such as volunteerism and other forms of social capital.
– D: Defensive private spending refers to investments made to protect against negative externalities (e.g., pollution control technologies).
– S: Activities that negatively impact social capital encompass elements like crime rates and family breakdowns.
– E: Costs associated with environmental deterioration, such as the depletion of natural resources and climate change impacts.
– N: This term represents activities that negatively impact natural capital (e.g., resource extraction and pollution).
Calculating the genuine progress indicator involves determining the value of each component using data from national statistical sources, economic studies, or other relevant data sources. After calculating the values for each component, the formula allows economists to calculate the overall Genuine Progress Indicator (GPI) for a given economy. By comparing the GPI values of different countries, analysts can assess which nations are making progress toward sustainable and equitable economic growth.
In summary, the genuine progress indicator (GPI) provides a more comprehensive view of economic growth by considering externalities and societal contributions. To calculate the GPI, economists use a formula that includes indicators from three primary categories: social, economic, and environmental. By calculating the GPI, analysts can evaluate a nation’s overall progress in areas such as health, education, income distribution, environmental sustainability, and social capital.

Criticisms and Limitations of the Genuine Progress Indicator
Despite its potential advantages as an economic metric, the Genuine Progress Indicator (GPI) has faced criticisms and limitations due to its subjectivity and complexity. Critics argue that its loosely defined nature makes it difficult to compare one economy to another. Additionally, assigning values to societal contributions, such as volunteering, can be problematic due to the varying interpretations of their worth.
One of the primary criticisms of GPI is that it can be subjective. Since its definition is broad and allows for different interpretations, practitioners have developed various accounting methods that can lead to inconsistencies when comparing one economy’s GPI with another. This lack of standardization makes it challenging to make meaningful comparisons between nations, limiting the usefulness of the metric for policymakers and researchers alike.
Another limitation of GPI is its complexity. The indicator includes 26 indicators in three categories: social, economic, and environmental. Assigning values to each indicator can be a daunting task, as their worth may differ depending on who ascribes the value. For instance, determining the value of volunteer work or housework can vary significantly, making it difficult to create an accurate accounting of a country’s GPI.
Despite these limitations, proponents argue that the Genuine Progress Indicator (GPI) offers a more comprehensive view of economic growth by taking into account externalities and societal contributions. Its ability to measure economic progress beyond traditional monetary measures makes it an important tool for understanding the true health of a nation’s economy.
In conclusion, while the Genuine Progress Indicator (GPI) presents advantages over the widely used gross domestic product (GDP), its limitations and criticisms should be acknowledged. By understanding these issues and working towards addressing them, researchers and practitioners can continue to refine the metric and contribute to a more holistic approach to measuring economic growth and prosperity.
If you enjoyed this content, don’t forget to subscribe to our newsletter for weekly updates on finance and investment strategies! Stay informed with us and take your investing game to the next level.

Real-World Applications of the Genuine Progress Indicator
The Genuine Progress Indicator (GPI) has gained increasing attention over the past few decades as a more comprehensive measure of economic growth compared to the widely used Gross Domestic Product (GDP). While both metrics have their unique strengths and weaknesses, understanding how the GPI is applied in practice can provide valuable insights into its potential impact on policymaking and decision-making processes.
One of the most notable applications of the GPI can be found in environmental sustainability initiatives. By accounting for the costs associated with pollution and resource depletion, the GPI encourages a more sustainable approach to economic growth. For instance, governments and businesses using the GPI may prioritize investments in renewable energy, waste reduction, and clean technologies, leading to both economic benefits and positive environmental outcomes.
Moreover, the inclusion of social indicators such as health, education, and income distribution within the GPI can help inform policy decisions that contribute to improved societal well-being. For example, policymakers may allocate resources more effectively towards public healthcare or education initiatives based on the findings from the GPI analysis. Additionally, the incorporation of this information into economic decision-making processes allows for a more holistic approach, addressing long-term challenges while promoting overall growth and stability.
At the regional level, cities and states have adopted the GPI as a tool to assess their economic progress and identify areas for improvement. For instance, Maryland and Vermont in the United States have been using the GPI since 1995 to evaluate their economies’ health beyond traditional measures such as GDP. This approach has helped these regions focus on sustainable development and informed decisions related to environmental protection, social services, and economic opportunities.
The European Union (EU) has also taken steps towards incorporating the GPI into its policy frameworks. The EU Sustainable Energy Week, which aims to promote sustainable energy solutions, utilizes the GPI as a benchmarking tool for assessing progress in energy efficiency and renewable energy adoption. This application of the GPI highlights its potential role in guiding policymakers towards more sustainable economic growth while maintaining competitiveness within the global economy.
Institutional investors are increasingly interested in the Genuine Progress Indicator as well, recognizing its potential impact on their portfolios and the companies they invest in. By considering the environmental and social implications of economic activity, institutional investors can make more informed investment decisions that align with their values and long-term interests. This shift towards socially responsible investing has led to a growing interest in incorporating the GPI into investment strategies, particularly within the impact investing sector.
As the use of the Genuine Progress Indicator continues to grow, it is important to acknowledge its limitations and challenges. Criticisms include issues related to subjectivity, data availability, and comparability across regions. Addressing these challenges will be essential for the GPI to gain widespread acceptance as a reliable economic measure and continue to influence policymaking and decision-making processes.
In summary, the Genuine Progress Indicator (GPI) is gaining traction as an alternative economic indicator that provides valuable insights into sustainable growth and societal well-being by accounting for externalities and social contributions. Its applications in various sectors—from environmental sustainability initiatives to institutional investing—demonstrate its potential impact on policymaking and decision-making processes, making it a promising tool for creating a more holistic approach to economic progress.

GPI and Institutional Investing: Opportunities and Challenges
The Genuine Progress Indicator (GPI) offers significant potential for institutional investors in the realms of impact investing and socially responsible investing. By using this alternative economic metric to measure growth, investment strategies can be tailored towards projects that contribute positively to society and the environment while minimizing negative externalities.
Institutional investors, such as pension funds, insurance companies, foundations, and endowments, manage large pools of capital. Their investments play a vital role in shaping the economy and society at large. Incorporating GPI data into their investment decision-making processes can help institutional investors to:
1. Identify potential opportunities for positive societal and environmental impact: Institutional investors may use GPI data to identify sectors or projects that contribute positively to social, economic, and environmental wellbeing. These investments align with the goals of impact investing, which aims to generate both financial returns and measurable social or environmental benefits.
2. Minimize negative externalities: By considering the impact of potential investments on GPI indicators, investors can minimize their exposure to projects that may negatively affect society and the environment. This aligns with socially responsible investing, which avoids investments in companies or projects that have a detrimental impact on these areas.
3. Enhance transparency and accountability: GPI data provides a comprehensive view of a country’s overall economic health and progress. Institutional investors can use this information to evaluate the sustainability and long-term viability of potential investments, ensuring that they are investing in projects that align with their values and contribute to a more sustainable future.
However, using GPI data for investment decisions also presents challenges:
1. Data availability and accuracy: As the GPI is not currently used as the standard economic metric, data availability and consistency can be an issue. Institutional investors must ensure they have access to reliable, comparable, and up-to-date GPI data to make informed decisions.
2. Complexity and subjectivity: The GPI includes 26 indicators across three categories (social, economic, and environmental), which can make it challenging for institutional investors to understand and interpret the data. Additionally, assigning values to societal contributions and externalities introduces a degree of subjectivity that can complicate investment decision-making.
3. Integration with existing investment frameworks: Institutional investors must consider how to integrate GPI data into their existing investment frameworks, such as modern portfolio theory and the efficient frontier. They may need to adapt their risk management strategies and performance benchmarks to account for this new metric.
In conclusion, institutional investors can benefit from using the Genuine Progress Indicator (GPI) in their investment decision-making processes for impact investing and socially responsible investing by identifying opportunities for positive societal and environmental impact and minimizing negative externalities. However, challenges related to data availability, complexity, subjectivity, and integration with existing frameworks must be addressed to effectively implement GPI into institutional investment strategies.

FAQs About the Genuine Progress Indicator
What sets the Genuine Progress Indicator apart from other economic metrics like the well-known Gross Domestic Product (GDP)? The primary difference lies in how they measure economic growth. While GDP focuses on the total value of goods and services produced within a country, the Genuine Progress Indicator goes beyond that by accounting for the externalities—the positive and negative costs associated with economic activity.
What are some examples of these externalities? The cost of environmental degradation such as pollution, resource depletion, and ozone layer depletion are common examples. Social externalities include factors like crime, volunteer work, and education that contribute to a nation’s overall well-being but are not reflected in GDP calculations.
How is the Genuine Progress Indicator calculated? The calculation of the GPI involves subtracting various costs from the country’s Gross Domestic Product (GDP). These costs include environmental degradation, crime, and social breakdowns that negatively impact the economy and overall welfare. Positive contributions to society like volunteer work and education are also included in the calculation.
What makes the GPI a better measure of economic progress compared to the Gross Domestic Product? By factoring in externalities, the Genuine Progress Indicator provides a more complete picture of a nation’s economic health and growth. It highlights both the positive and negative consequences of economic activities, allowing for informed decision-making and policy implementations that promote sustainable development.
When was the Genuine Progress Indicator introduced? The concept can be traced back to the 1930s when economist Simon Kuznets warned that GDP alone could not measure a nation’s welfare. However, it wasn’t until the 1990s that the GPI was officially developed by Redefining Progress in collaboration with Clifford Cobb and Ted Halstead.
What are some criticisms of the Genuine Progress Indicator? Some critics argue that the subjective nature of assigning values to various societal contributions and environmental costs makes it difficult to compare GPIs between different countries or regions. Additionally, there is no universally accepted methodology for calculating the GPI, which adds to its complexity and potential inconsistencies.
Despite these challenges, proponents of the Genuine Progress Indicator believe that it offers a more holistic view of economic growth by incorporating externalities and recognizing the importance of social and environmental factors in shaping a nation’s prosperity.
 Next entry · No. 1,877Understanding the Significance of Gross Processing Margin (GPM) in Commodity Trading
See also
-
 No. 5,740
03 Oct 2025
19 min
The Comprehensive Guide to Understanding the FT Wilshire 5000 Index (FTW5000)
Business Finance
No. 5,740
03 Oct 2025
19 min
The Comprehensive Guide to Understanding the FT Wilshire 5000 Index (FTW5000)
Business Finance -
 No. 5,463
11 Sep 2025
23 min
Understanding the Velocity of Money: Measuring the Rate at Which Money Changes Hands in an Economy
Economics
No. 5,463
11 Sep 2025
23 min
Understanding the Velocity of Money: Measuring the Rate at Which Money Changes Hands in an Economy
Economics -
 No. 4,424
17 Jun 2025
20 min
Understanding Retail Sales: A Key Economic Indicator for Investors
Economics
No. 4,424
17 Jun 2025
20 min
Understanding Retail Sales: A Key Economic Indicator for Investors
Economics -
 No. 4,303
07 Jun 2025
20 min
Understanding Real vs Nominal Gross Domestic Product (GDP): Measuring Economic Output with Accuracy
Economics
No. 4,303
07 Jun 2025
20 min
Understanding Real vs Nominal Gross Domestic Product (GDP): Measuring Economic Output with Accuracy
Economics -
 No. 4,099
22 May 2025
19 min
Procyclic: Understanding the Correlation between Economic Indicators and Business Cycles
Economics
No. 4,099
22 May 2025
19 min
Procyclic: Understanding the Correlation between Economic Indicators and Business Cycles
Economics -
 No. 4,032
16 May 2025
20 min
Understanding the Producer Price Index (PPI): Measuring Wholesale Inflation
Economics
No. 4,032
16 May 2025
20 min
Understanding the Producer Price Index (PPI): Measuring Wholesale Inflation
Economics