Lump Sum vs Dollar-Cost Averaging: What Waiting Costs on $120,000
On $120,000, a 12-month schedule costs about $1,681 of expected return. The lump sum wins whenever the market beats the 4% cash yield — nothing more.
A $120,000 inheritance lands in your checking account and you have to decide what to do with it on Monday. The lump sum vs dollar-cost averaging question — invest it all now, or feed it in over the next six or twelve months — has a defensible answer, and it is that investing a windfall all at once wins most of the time, by roughly $1,681 on $120,000 over a twelve-month window at today's rates. That is the average. The rest of this guide is about the cases where the average is the wrong thing to optimise.
This is general information built on stated assumptions and rates as of September 2026, not personal advice. Every scenario below is labelled as an assumption; none of it is a forecast, and none of the market paths are historical.
Lump Sum vs Dollar-Cost Averaging: Why All At Once Usually Wins
The mechanism is duller than the debate around it. Money you hold back is not earning the portfolio's return; it is earning the cash yield. Every dollar you release in month seven has spent six months in a Treasury bill instead of in the market, so the entire question reduces to one comparison: over the window, did the market beat cash?
That is why the standard finding runs the way it does. FINRA's own investor education states it flatly — dollar-cost averaging "often produces lower returns than lump sum investing, especially over longer periods of time" — and Vanguard's widely cited Dollar-cost averaging just means taking risk later found lump-sum investing ahead of a twelve-month schedule in roughly two-thirds of historical periods across the US, UK and Australian markets. Two-thirds is not a coincidence; it is close to the share of twelve-month stretches in which equities out-earn cash.
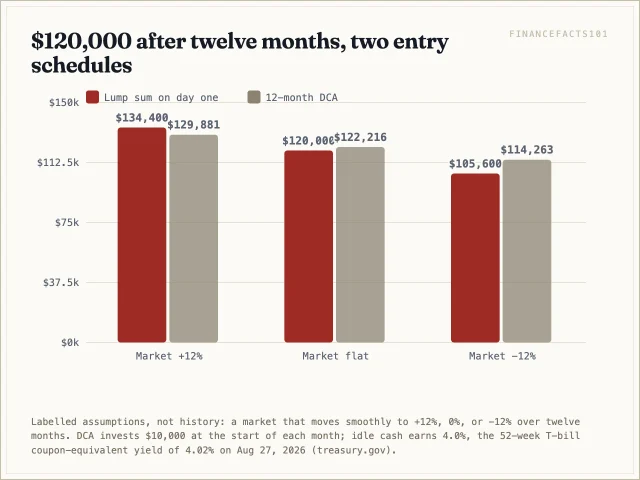
Here is that idea priced out. Take $120,000 and three clearly-labelled assumptions about the following twelve months: a market that rises 12%, a market that goes nowhere, and a market that falls 12%, each moving smoothly. The lump sum ends at $134,400, $120,000 and $105,600. A twelve-month schedule of $10,000 monthly buys, with the idle balance parked at 4.0%, ends at $129,881, $122,216 and $114,263. Lump sum wins the rising year by $4,519, loses the flat year by $2,216, and loses the falling year by $8,663.
Who This Is For — and Who It Isn't
This is for someone in the United States holding a defined pile of cash they intend to invest for a decade or more: an inheritance, a bonus, a home-sale settlement, a severance package, a 401(k) rollover, a vested equity grant. It assumes you have already funded an emergency reserve, you have no expensive debt, and you have picked — or are about to pick — a target stock/bond mix.
It is not for money with a job to do inside three years. If the cash is a down payment for 2028, the answer is neither schedule; it belongs in T-bills or a high-yield savings account, both paying near 4% as of September 2026. It is also not for anyone whose real question is which fund to buy — that is the index funds versus ETFs decision, and it matters more than this one.
The Distinction That Resolves Most of the Confusion
The phrase "dollar-cost averaging" covers two completely different things, and conflating them is why so much of this argument goes nowhere.
Investing $800 out of every paycheck is not dollar-cost averaging in the sense this article means. There is no lump sum being withheld; the money did not exist last month and you are simply investing it as it arrives. Nothing is sitting in cash, nothing is being timed, and no expected return is being given up. That habit is close to unambiguously good, which is why investor.gov's description of dollar-cost averaging — investing equal amounts at regular intervals regardless of market conditions — reads so positively.
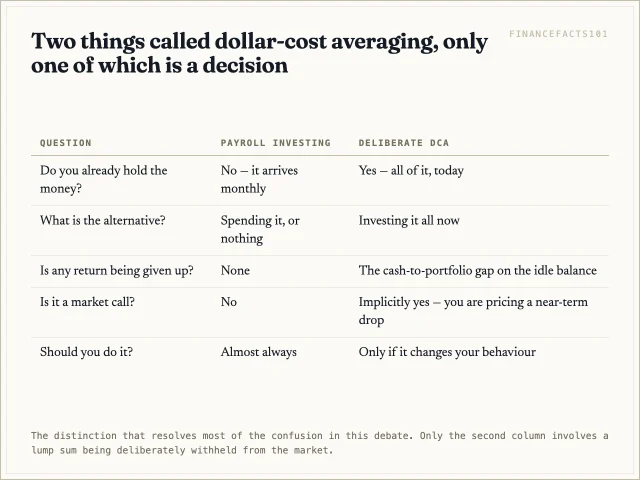
Deliberate dollar-cost averaging is a different act. You already hold the whole sum. Choosing to release it in twelfths is choosing to keep eleven-twelfths in cash for a while, which is an implicit forecast that the next few months will be a worse time to buy than the months after. Everything positive said about the payroll habit — discipline, automation, buying more shares when prices fall — is true of the payroll habit and does not transfer. The site's longer treatment of dollar-cost averaging and the entry on systematic investment plans both describe the payroll version.
The Crossover: The Market Only Has to Beat Cash
Most write-ups say the lump sum wins because markets usually rise. That is slightly wrong, and the correction is the single most useful number here.
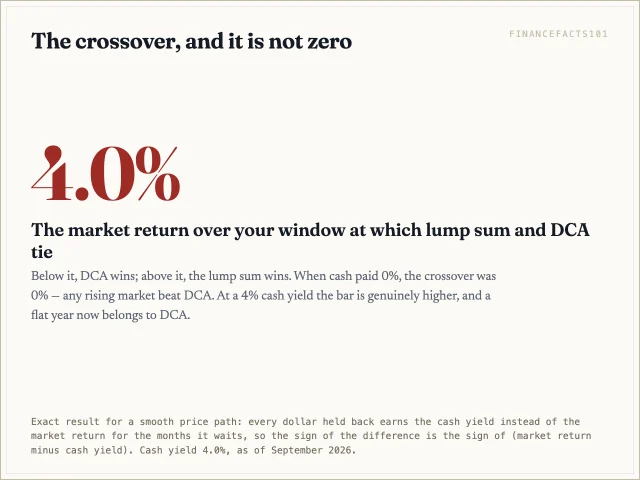
For a smooth price path, the lump sum and the schedule tie exactly when the market's return over the window equals the cash yield. Each dollar you hold back trades market return for cash return over the same number of months, so the sign of the difference is the sign of the gap between the two rates. With cash at 4.0%, a market that rises 3% over the year is a market the DCA schedule wins. In 2021, when money-market funds paid effectively nothing, any rising market beat the schedule. The bar is higher now.
Real prices are not smooth, and that matters in the honest direction. Run the same $120,000 through a year that ends up 7% but dips 20% at the midpoint, and the twelve-month schedule finishes $14,985 ahead, because it bought the dip. Run it through a year that ends up 7% after peaking 20% higher at midyear and the lump sum wins by $10,671. The crossover tells you which way to bet; it does not tell you what happens. Run your own window and cash rate through the dollar-cost averaging calculator.
$120,000 Through a Falling Year
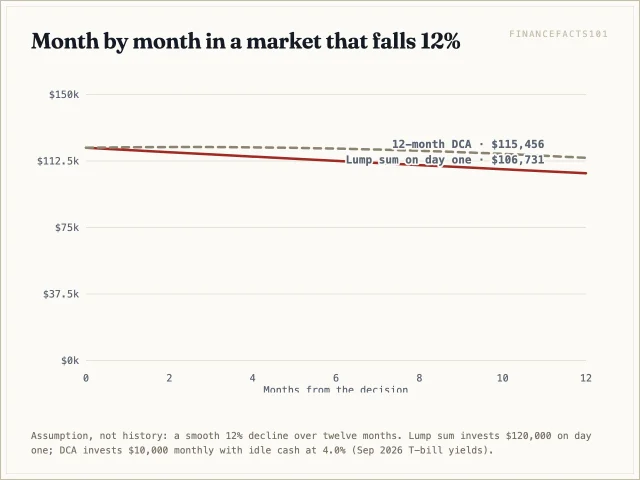
The falling-market path is worth looking at closely because it is the one people are actually buying protection against. The DCA balance barely moves for four months — it is still 70% cash, earning 4% while the invested slice sinks — and only drifts below $120,000 in month five. The lump sum is underwater from week one and finishes at $105,600 against the schedule's $114,263.
That $8,663 gap is the product. Not a higher return: a shallower hole, arriving later, in a shape most people find easier to sit through.
What a 4% Cash Yield Does to the Trade-Off
The cost of waiting is the gap between what the portfolio earns and what the sidelined cash earns, and the second term is unusually large right now. As of August 27, 2026, Treasury bill coupon-equivalent yields ran 3.72% at four weeks and 4.02% at 52 weeks. On September 16, 2026 the FOMC raised the federal funds target range a quarter point to 3.75–4.00%, and bill yields rose with it: by September 23 they ran 3.88% at four weeks and 4.44% at 52 weeks. The 4% used below is, if anything, slightly low — and a higher cash yield only makes the schedule cheaper. T-bills also escape state income tax, which nudges the effective yield higher in California or New York.
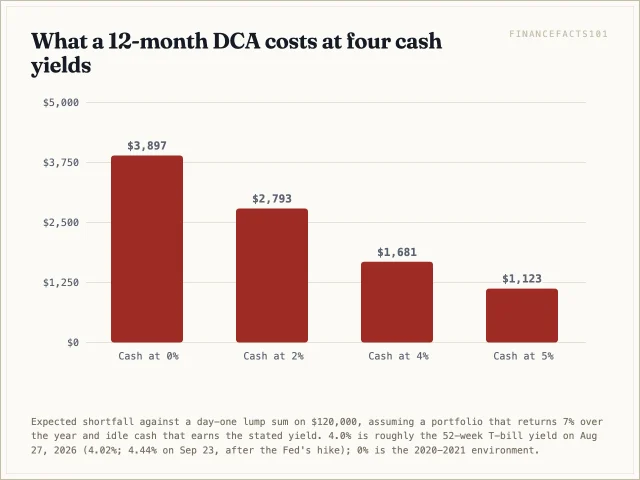
Assume a 7% portfolio return and hold everything else fixed. A twelve-month schedule on $120,000 costs $3,897 when cash pays nothing, $2,793 at 2%, $1,681 at 4%, and $1,123 at 5%. The insurance got roughly 57% cheaper between a zero-rate world and this one. Anyone repeating advice calibrated to 2021 is quoting a stale price. The September hike made the insurance a little cheaper still; if the Fed cuts, the price goes back up.
Pricing the Insurance Instead of Arguing About It
The productive move is to stop treating this as a contest between a right answer and a wrong one, and price it as what it is: a premium paid for a smaller worst case.
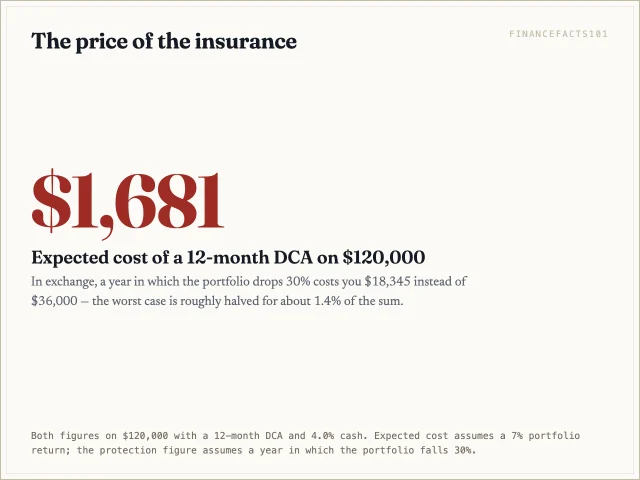
On $120,000, the premium is about $1,681 of expected return — 1.4% of the sum, one-off. The payout, in a year the portfolio falls 30%, is that your loss is $18,345 rather than $36,000. You are spending roughly 1.4% to halve the worst realistic twelve-month outcome. Framed that way, it is neither obviously smart nor obviously foolish; it depends entirely on what a $36,000 paper loss would make you do.
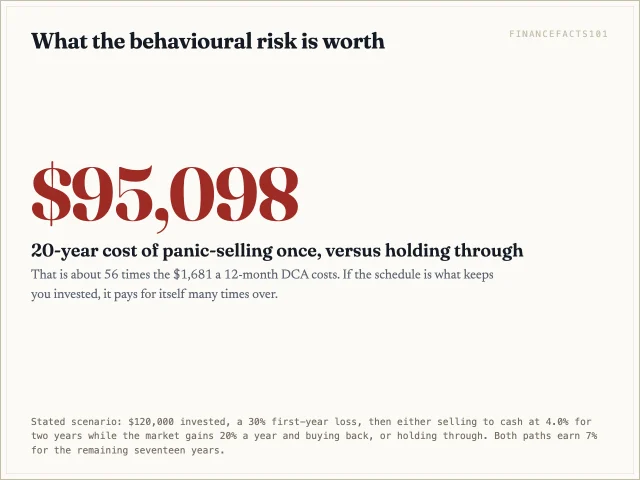
And that is the number that settles it for a lot of people. Take the same $120,000, a 30% first-year loss, and an investor who sells to cash, waits out two years of 20% recovery, then buys back. Twenty years on, that path lands about $95,098 behind the one that held. The panic costs roughly 56 times what the schedule costs. If a twelve-month drip is what keeps your hands off the sell button, it is cheap at ten times the price — and that is a real answer to "should I invest $100,000 now or over time", not a dodge.
Sequence Risk: The Version That Is True
There is a widespread claim that a bad first year hurts more than a bad late year. For a lump sum you never touch, that claim is false, and it is worth seeing why.
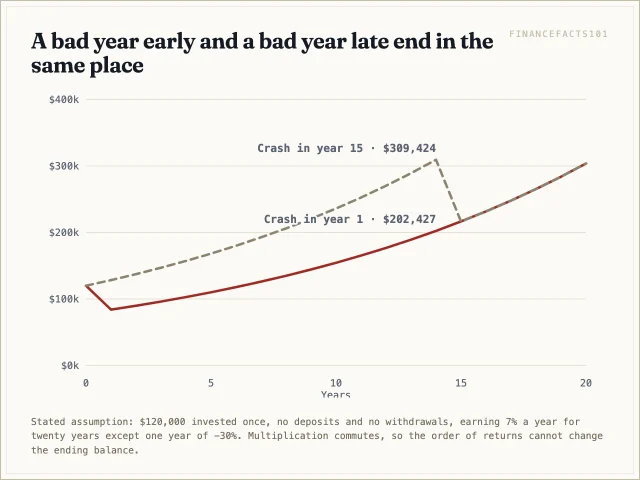
Two paths: $120,000 at 7% a year for twenty years, with one -30% year, in year 1 or in year 15. Both finish at $303,788. Multiplication commutes; the order of returns cannot change a no-flow ending balance. What differs is the size of the drop on the statement — $36,000 in year one, $92,827 in year fifteen — and, counter-intuitively, the later one is the bigger dollar shock.
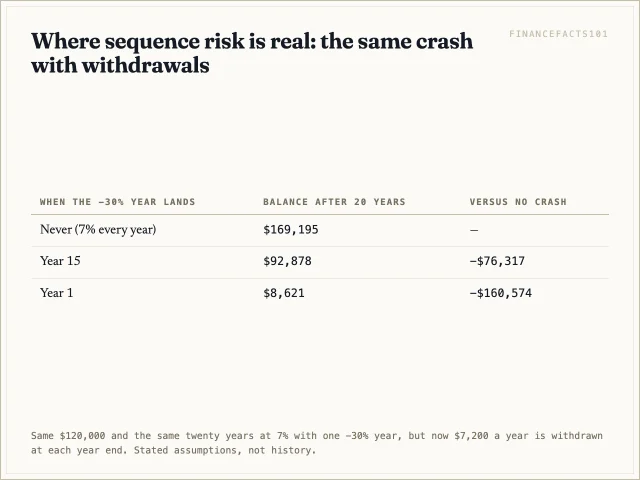
Sequence risk becomes real the moment there are cash flows. Add a $7,200 annual withdrawal to that same twenty years and the crash year decides everything: $8,621 left if it lands in year one, $92,878 if it lands in year fifteen. So the honest statement is narrower than the usual one. A bad first year is dangerous if you are drawing on the money, or if it is early enough in your investing life that it changes your behaviour permanently. It is not dangerous to the arithmetic of a buy-and-hold lump sum.
Choosing the Window If You Go That Route
If you decide to buy the insurance, buy the cheap version. Cost scales with how long the money sits.
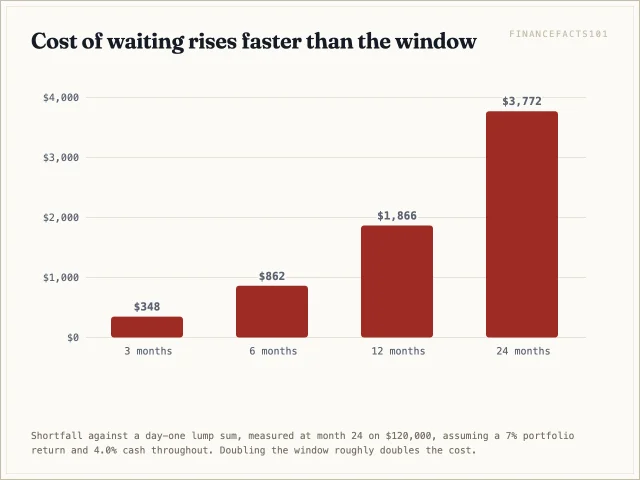
Measured at month 24 on $120,000 at the same assumptions, a three-month schedule costs about $348, six months $862, twelve months $1,866, and twenty-four months $3,772. Roughly linear in window length — double the window, double the cost, with none of the benefit doubling in any meaningful sense, because most of the reduction in worst-case pain arrives in the first few tranches.
Three practical rules. Automate the buys on fixed dates so the schedule cannot become a running judgement call. Do not extend the window because the market fell — that is the moment the schedule was designed for. And write down the end date before you start, because a schedule without one is just cash. The investment return calculator will price your specific window against a day-one entry.
Waiting for a Better Price
A common third option is to hold the cash until valuations look friendlier. This is market timing with a more respectable vocabulary, and it fails for a specific reason: valuation measures have weak short-horizon predictive power, so the signal that says "expensive" today can keep saying it for years while the market compounds. You need to be right twice, on the exit and the re-entry, and the re-entry is the harder one — it requires buying when the news is worst.
The variance in outcomes across those attempts is enormous relative to the $1,681 at stake, a point the entry on dispersion makes in general terms. If you would not sell your existing portfolio today at these valuations, you have already decided that today's price is acceptable, and holding new cash out is inconsistent with that.
Asset Allocation Beats Both Schedules
This deserves saying loudly, because the entry-schedule debate absorbs attention out of all proportion to its stakes. The SEC's Beginners' Guide to Asset Allocation puts it plainly: "some financial experts believe that determining your asset allocation is the most important decision that you'll make with respect to your investments." The companion page on asset allocation at investor.gov ties the mix to time horizon and risk tolerance, which is exactly the calculation the schedule debate is standing in for.
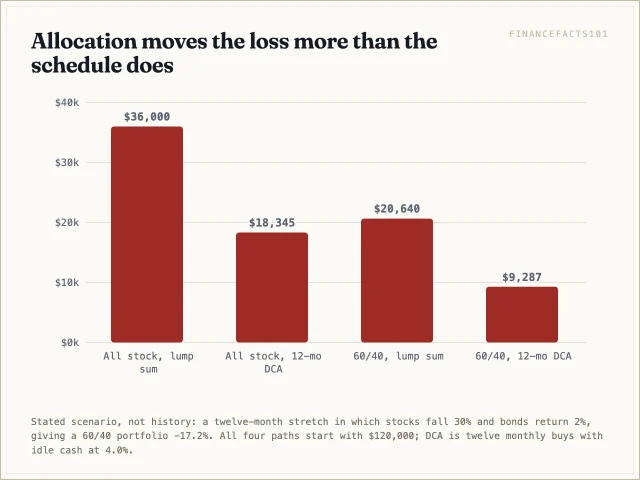
Price it. In a stated scenario where stocks fall 30% and bonds return 2%, $120,000 all in stocks loses $36,000 as a lump sum and $18,345 on a twelve-month schedule. The same $120,000 in a 60/40 mix loses $20,640 as a lump sum. Changing the allocation did nearly as much as changing the schedule — and the allocation keeps doing it every year for the next twenty, while the schedule is a one-time event. If a 30% stock drawdown is what worries you, the honest fix is fewer stocks, not slower stocks. The site's asset allocation guide covers the mechanics.
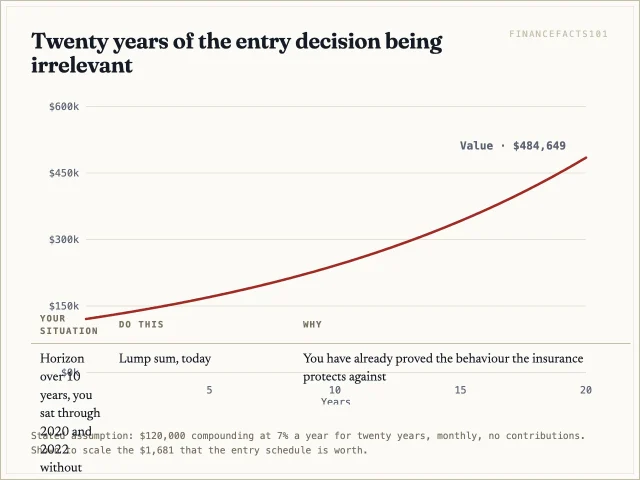
For scale: that $120,000 compounding at an assumed 7% reaches about $484,649 in twenty years. The $1,681 entry decision is roughly a third of one percent of that. A single percentage point of advisory fee over the same period costs many multiples of it.
Taxes When the Money Came From a Sale
The tax facts usually land before the investing decision, and occasionally they invert it.
If the windfall came from selling appreciated assets, the tax is owed on the sale, not on what you do next; carve the estimated liability out first and keep it in T-bills rather than investing it. Assets held more than one year get long-term treatment at 0%, 15% or 20% depending on taxable income, per IRS Topic 409. Inherited assets are the friendlier case: they generally receive a stepped-up basis at the date of death, so selling soon after produces little or no gain — which is precisely why an inherited brokerage account can be repositioned cheaply, and why "should I sell the inherited stock" is usually a smaller question than it feels.
One genuine argument for spreading purchases in a taxable account: it staggers your cost basis across twelve dates, which gives more tax-loss harvesting opportunities later. It is a second-order benefit worth perhaps a few hundred dollars, not a reason on its own.
The Rollover That Sat in Cash for Three Years
The most expensive version of this mistake is not choosing the wrong schedule. It is choosing no schedule.
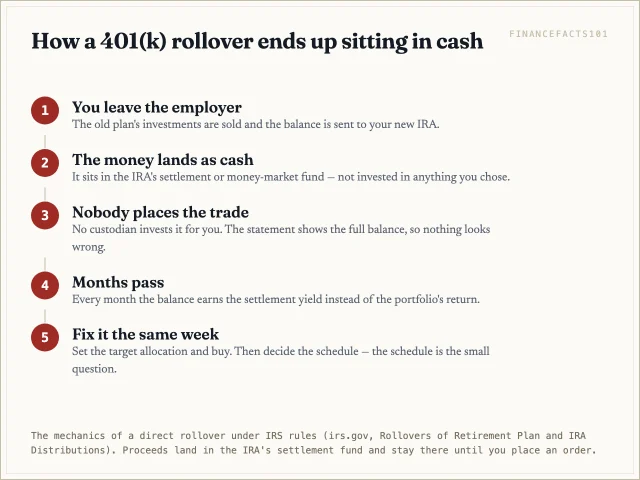
When you roll a 401(k) into an IRA, the plan liquidates your holdings and the cash lands in the new account's settlement fund. Nothing invests it. Under IRS rollover rules the transfer itself is complete and non-taxable — the balance shows in full on the statement, so nothing looks broken — but the money is in cash until you place an order. People discover this years later.
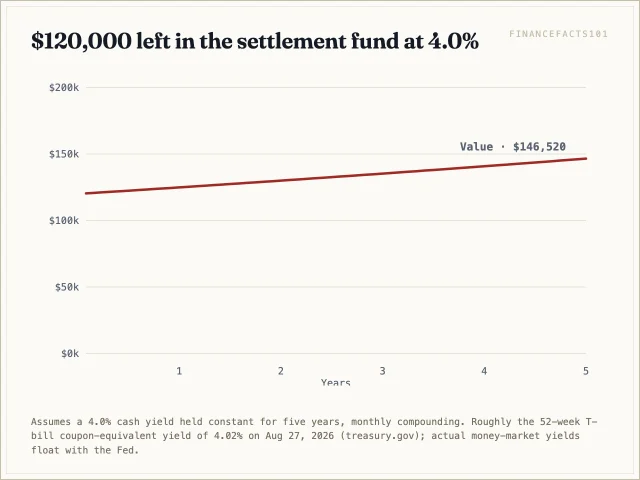
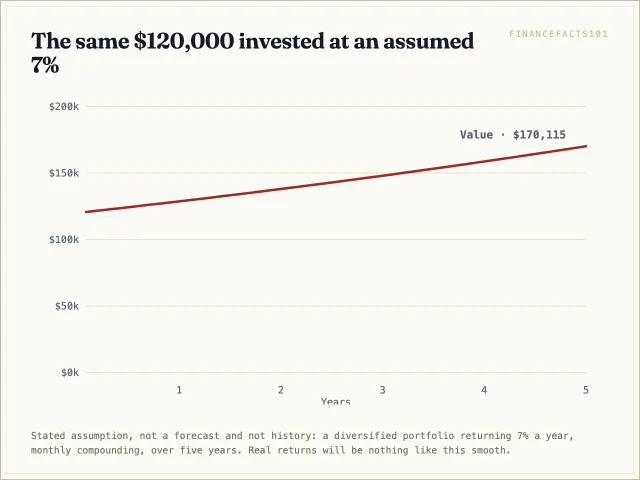
The two curves are the same $120,000 over five years: one at a 4.0% cash yield, one at an assumed 7% portfolio return. Cash reaches about $146,520; the portfolio about $170,115, a gap of $23,595. Five years of accidental cash costs fourteen times what a deliberate twelve-month schedule costs, and about six times the twenty-four-month version. If you are being advised through a rollover, the Department of Labor's guidance on choosing an adviser is worth reading first. Then check the compound interest calculator or the CAGR calculator against your own settlement-fund yield.
How to Decide
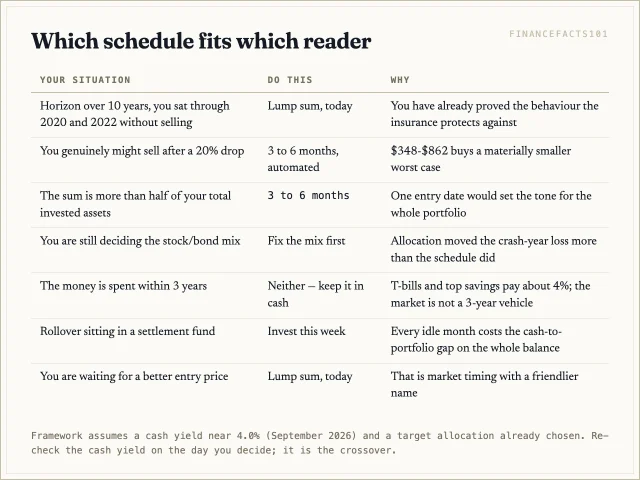
The rule that follows from all of the above is short. Pick the allocation first, because it moves more money than the schedule does. Then, if you have held through a real drawdown without selling and the horizon is long, invest the whole sum on the day the money clears. If you have not, or if the windfall is large relative to everything else you own, take three to six months on automated dates — $348 to $862 on $120,000, a fair price for a much smaller worst case. Twelve months is defensible for a first-time investor and hard to justify for anyone else; twenty-four months is not a schedule, it is a market call. Whatever you choose, set the dates in advance and run the numbers for your own sum and cash yield in the dollar-cost averaging calculator before you commit.
FAQ
Should I invest $100,000 now or over time?
Now, if the horizon is long and you will not sell in a drawdown — the expected cost of a twelve-month schedule on $100,000 at a 4% cash yield and a 7% assumed return is about $1,400. Over time, in three to six monthly tranches, if a 20–30% paper loss in the first year would plausibly push you to sell. The right question is not which produces the higher average, but which one you will still be holding in five years.
Does dollar-cost averaging still make sense when cash pays 4%?
It makes more sense than it did at 0%, because the cost of waiting is the gap between the portfolio return and the cash yield. At 4% cash a twelve-month schedule on $120,000 costs about $1,681 versus $3,897 when cash paid nothing. The crossover also moves: DCA now wins any year in which the market returns less than about 4%, including a flat one.
Is investing every paycheck the same as dollar-cost averaging?
No, and the difference is the whole argument. Payroll investing puts money to work as it arrives — no lump sum is being held back and no return is being sacrificed. Deliberate dollar-cost averaging holds cash you already have. The evidence that lump-sum investing usually wins says nothing against the payroll habit.
What if the market crashes right after I invest the lump sum?
If you hold, the order of returns does not change your twenty-year balance: $120,000 at 7% with one -30% year finishes at $303,788 whether the bad year is the first or the fifteenth. The danger is behavioural, not arithmetical — selling after that drop and returning two years later cost about $95,098 in the scenario modelled above.
Sources
- FINRA, The Benefits and Limitations of Dollar-Cost Averaging — DCA "often produces lower returns than lump sum investing"
- SEC, Beginners' Guide to Asset Allocation, Diversification, and Rebalancing — allocation as the most important investment decision
- Investor.gov, Asset Allocation and Diversification — time horizon and risk tolerance
- Investor.gov, Dollar Cost Averaging — the SEC's definition
- U.S. Treasury, Daily Treasury Bill Rates, 2026 — 3.72% at 4 weeks, 4.02% at 52 weeks, coupon equivalent, August 27, 2026; 3.88% and 4.44% on September 23, 2026
- TreasuryDirect, Treasury Bills — terms, auctions, and state tax exemption
- Federal Reserve, FOMC statement, September 16, 2026 — federal funds target range raised 0.25 point to 3.75–4.00%, 12–0 vote
- IRS, Topic 409, Capital Gains and Losses — holding period and long-term rates
- IRS, Rollovers of Retirement Plan and IRA Distributions — direct rollovers and the 60-day rule
- U.S. Department of Labor, Choosing the Right Person to Give You Investment Advice — questions to ask before a rollover
- Vanguard, Dollar-cost averaging just means taking risk later — lump sum ahead in roughly two-thirds of historical periods
 Next entry · No. 5,950Thrift Savings Plan: How Much to Contribute, Which Fund, and Whether to Roll It Out
See also
-
 No. 262
07 Apr 2024
23 min
Understanding Attribution Analysis: A Comprehensive Guide for Institutional Investors
Investments
-
 No. 5,983
17 Oct 2026
18 min
Target-Date Fund vs Index Funds: Which Should You Hold?
Investments
-
 No. 855
20 Jun 2024
20 min
Understanding Custodial Accounts: An Essential Guide for Professional and Institutional Investors
Investments
-
 No. 404
21 Apr 2024
19 min
Understanding Beta: Measuring Systematic Risk in Finance and Investment
Investments
-
 No. 352
11 Apr 2024
22 min
Understanding the Barbell Investment Strategy: A Balance Between Short-Term and Long-Term Securities
Investments
-
 No. 323
09 Apr 2024
23 min
Understanding Balanced Funds: A Mix of Stocks and Bonds for Professional Investors
Investments