Renting vs Buying a Home: The Real Math

A $400,000 house at 6.66% costs $37,100 in year-one unrecoverable costs; renting the same house costs $26,600. The 7-year verdict and the break-evens.
Renting vs buying a home is a comparison of two sets of unrecoverable costs — not rent against a mortgage payment. Get that one framing right and both slogans collapse: "renting is throwing money away" ignores that most of an owner's payment is thrown away too, and "buying always wins" dies the moment you price transaction costs and a short holding period. This guide runs the honest version on one house — $400,000, 10% down, at the 6.66% average 30-year rate from the Freddie Mac Primary Mortgage Market Survey for the week of August 27, 2026 — carried through a seven-year horizon, with every assumption on the table.
Scope honesty: this is general information built on stated national-average assumptions, not personal advice. Your rate, rent, taxes, and market will differ — the method transfers even where the numbers do not.
Who this is for — and who it is not for
This is for a US household that could plausibly do either this year: enough saved for a 10% down payment, income that qualifies for a mortgage, and a genuine choice between signing a lease and signing a closing package. It is also for anyone who has been told the decision is obvious in either direction.
It is not for you if you cannot yet clear the down payment plus an emergency fund — then the answer is rent, full stop, and the interesting question is your savings rate. It is also not the right frame for buying rental property as an investment, which is a business decision with different math, or for markets outside the US, where tax and transaction structures change everything.
The wrong comparison — and the right one
The comparison people instinctively make is rent versus the monthly mortgage payment. That is wrong in both directions. The mortgage payment includes principal, which is not a cost at all — it is a transfer into your own equity. And it excludes property tax, insurance, maintenance, and mortgage insurance, which are costs, every dollar as gone as rent.
The right comparison sets the renter's unrecoverable cost — rent — against the owner's unrecoverable costs: mortgage interest, property taxes, insurance, maintenance, PMI, and a slice of the transaction costs of buying and selling, spread over the years of ownership. Whichever side burns less money each year, while the rest of each side's cash goes to work (equity for the owner, an investment portfolio for the renter), is winning the actual economics.
Everything below is that comparison, worked in dollars you can check.
The worked example: $400,000, 10% down, 6.66%
One house carries the whole article. The assumptions, each labeled:
- Price: $400,000 — a round number just below the $434,100 median existing-home price for July 2026 reported by the National Association of Realtors.
- Down payment: 10% ($40,000), so the loan is $360,000; buyer closing costs of $12,000 (3% of price — the CFPB puts typical closing costs at 2%–5% of the loan).
- Rate: 6.66%, the 30-year fixed average for the week of August 27, 2026 (Freddie Mac PMMS). How lenders arrive at a quote is its own subject — see how mortgage rates are priced.
- Property tax: 1.1% of value per year, the Census-based national effective average on owner-occupied homes per the Tax Foundation — the spread runs from 0.29% in Hawaii to 1.88% in New Jersey and Illinois.
- Insurance: $2,470 a year, Bankrate's 2026 national average, growing 3% a year.
- Maintenance: 1% of value a year — the low end of the standard 1%–2% rule of thumb, not a measured statistic. Older homes run closer to 2%.
- PMI: 0.6% of the loan a year until the balance reaches 80% of value, since 10% down is below the 20% threshold.
- Rent for the equivalent house: $2,200 a month, growing 3% a year. For calibration: HUD's FY2026 Fair Market Rent for a median two-bedroom is $1,573, and industry indexes put the national median asking rent near $1,670 in early 2026 — a comparable three-bedroom single-family house rents well above both. $2,200 gives a price-to-rent ratio of 15.2, close to the national norm.
- Appreciation: 4% a year, just under the 4.26% long-run annual average of the FHFA House Price Index since 1991. Investment return: 7% a year for the renter's portfolio — deliberately below the roughly 10% long-run annualized total return of the S&P 500, to avoid stacking the deck for renting.
- Horizon: 7 years, near the typical tenure of a first home. Selling costs at exit: 6.5% of sale price — agent commissions plus transfer taxes, title, and concessions.
What each side actually pays every month
Run the amortization formula on $360,000 at 6.66% and the principal-and-interest payment is $2,313 a month. Stack the full cost of ownership on top and month one looks like this:

The owner's outlay is $3,399; the renter's is $2,215. But the sharper number is inside the owner's column: of that $3,399, only $315 builds equity. The other $3,084 — $1,998 of interest, $367 of tax, $206 of insurance, $333 of maintenance, $180 of PMI — is exactly as unrecoverable as rent. In month one, the owner "throws away" $3,084 to the renter's $2,215.
That gap is the honest starting line. Ownership earns it back later, through amortization and appreciation — or it doesn't, which is what the rest of the math decides.
Equity builds slowly at first
A 30-year amortization schedule is heavily front-loaded with interest: at 6.66%, about 86% of the first payment is interest, and the split improves only gradually — the mechanics are laid out in our entry on how an amortization schedule works.

The consequence for this decision: after year one the balance has fallen only to $356,097 — $3,903 of principal retired. After five years, $337,613. After seven years, $326,358. Seven years of $2,313 payments — $194,331 of cash — retire just $33,642 of principal. Amortization does build wealth, but in the early years it is a slow drip, which is why appreciation and holding period end up carrying the argument.
Year one: $37,100 versus $26,600
Add up each side's first full year of unrecoverable costs:
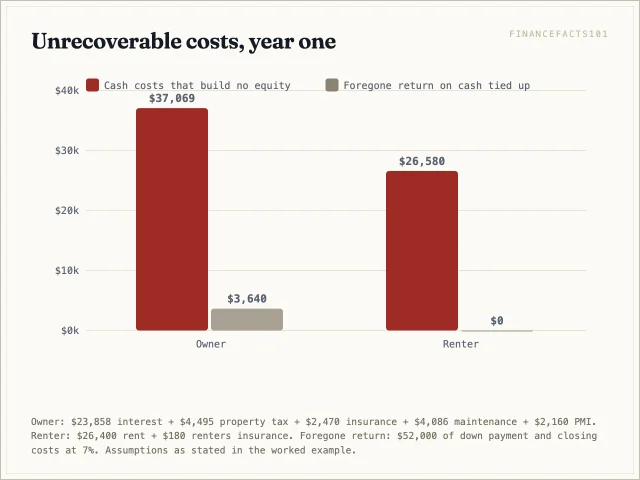
The owner burns $37,069 — $23,858 interest, $4,495 property tax, $2,470 insurance, $4,086 maintenance, $2,160 PMI. The renter burns $26,580 in rent and renters insurance. And the owner's $52,000 of down payment and closing costs, had it stayed invested at 7%, would have earned about $3,640 — a real cost even though no bill ever arrives for it.
Year one, then, favors the renter by roughly $14,000. Buying is a bet that equity and appreciation will claw that back, year after year, faster than the renter's portfolio compounds.
The seven-year verdict
Carry every line for seven years — rent rising 3% annually, the house appreciating 4%, PMI dropping in month 28 once the loan-to-value ratio crosses 80%, the renter investing both the $52,000 up front and the monthly cash-flow difference at 7%:
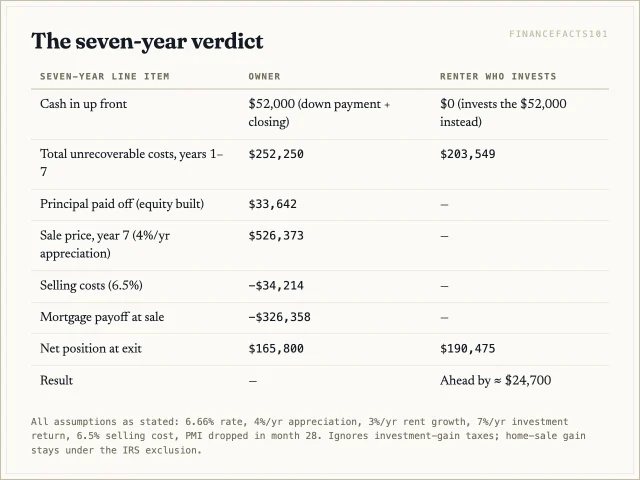
Sell in year 7 at $526,373, pay $34,214 in selling costs, retire the $326,358 balance, and the owner walks away with $165,800. The renter's portfolio stands at $190,475. Under these assumptions, the renter who actually invests the difference finishes about $24,700 ahead — and the year-by-year picture shows how persistent the gap is:
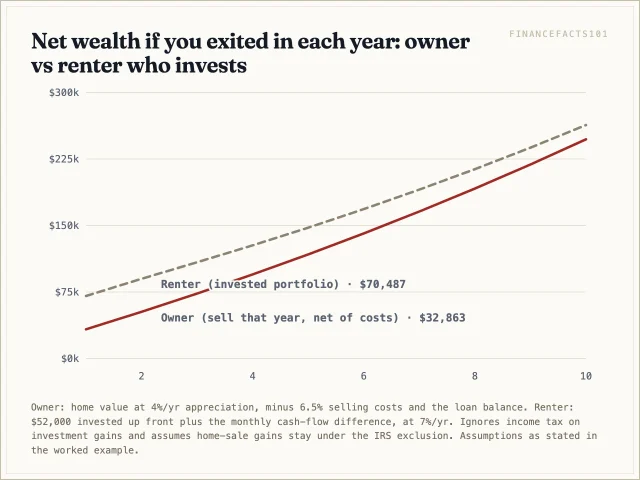
The owner's line climbs faster and the lines converge, but at 4% appreciation they do not cross until roughly year 15. The verdict is honest, and so are its caveats: nudge appreciation to 5% and the crossover jumps to about year 6; drop it to 3% and buying never catches up within 25 years. The result is a close call resting on the appreciation assumption and, above all, on the renter's discipline — a renter who spends the difference instead of investing it loses to the owner easily, because the owner's saving is forced.
The one ratio worth checking: price-to-rent
You can compress most of this article into one number: the price-to-rent ratio — the price of a home divided by the annual rent of a comparable one. The worked example sits at 15.2 ($400,000 ÷ $26,400). As a rough rule at 2026 rates: below about 15, buying gets competitive fast; above about 20, renting is so much cheaper month to month that the invested savings are hard to beat.
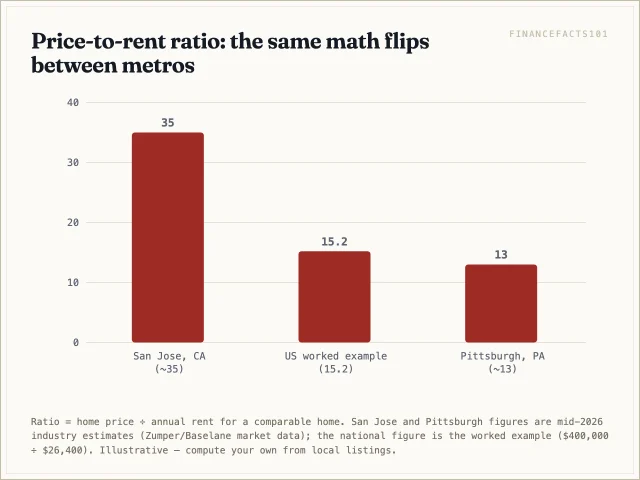
Re-run the model at a ratio of 12.6 — the same house renting for $2,650, typical of metros like Pittsburgh or Cleveland — and the owner overtakes the renter in under five years. Run it at a ratio near 24 and renting wins by six figures at every horizon out to 25 years; San Jose, at a ratio around 35 on mid-2026 market data, is off that chart entirely. Same rate, same house price math, opposite answers. Check the ratio in your own zip code from live listings before believing any national headline, and note that a home's assessed value for tax purposes is a different number again — see how assessed value works.
Holding period dominates everything else
Why does every serious rent-vs-buy analysis obsess over how long you will stay? Transaction costs.

Buying and later selling the example house costs about $46,200 — roughly 9% of the purchase price — no matter what the market does in between. Held for one year, that is a $46,200 toll on a single year of ownership; held for fifteen, it amortizes to nearly nothing. That is the whole reason short stays favor renting: sell inside year one of a flat market and you lose most of the down payment; even in the base case, the owner who sells before about year two walks away with less cash than went in. Under five years of expected tenure, renting wins in most US markets at 2026 prices and rates. Past ten, the toll fades and ownership's engines — fixed principal-and-interest, compounding appreciation — take over.
Leverage cuts both ways
A 10% down payment means 10-to-1 leverage, and leverage is symmetric.

If the $400,000 house appreciates 5% in year one, the owner's $40,000 stake gains $20,000 — a 50% return on cash, the magic every homeownership pitch leans on. If the market falls 5%, the same arithmetic runs in reverse: half the down payment gone on paper. Add a forced sale — job loss, relocation, divorce — and 6.5% selling costs on the reduced price take another $24,700, wiping out more than the entire down payment. Nationally, prices falling 5% in a year is uncommon; in any single metro it is not. Leverage is why buying with a thin cushion and an uncertain job is dangerous even when the long-run averages favor owning.
The tax break most owners never get
The mortgage-interest deduction is the most overrated line in the pro-buying case. Deductions only matter if you itemize, and itemizing only matters to the extent your deductions exceed the standard deduction you would get anyway — $32,200 for a married couple filing jointly in 2026 (IRS Topic 501). Post-2018, only about 11% of filers itemize at all.

Run the worked example: $23,858 of interest (deductible per IRS Publication 936) plus $4,495 of property tax plus an illustrative $6,000 of state income tax totals $34,353 — just $2,153 over the standard deduction. At the 22% bracket, the actual tax saving is about $474 in year one, shrinking as interest declines. Not zero, but two orders of magnitude short of "the government pays part of your mortgage." Single filers, with a $16,100 standard deduction, keep more of the benefit; couples in low-tax states often keep none.
Hidden costs owners forget
The 1% maintenance line deserves suspicion — in the expensive direction. It is an average across quiet years and roof years: a roof runs $10,000–$20,000, an HVAC system $7,000–$12,000, a water heater $1,500–$3,000, and none of them asks whether this is a convenient year. On top of maintenance sit the costs that surveys show buyers routinely miss: property-tax reassessment after a sale (many jurisdictions reset to your purchase price), insurance premiums that have been climbing far faster than inflation in storm- and fire-exposed states, HOA dues and special assessments, and the furniture-and-fixes surge of the first year. A budget that only fits the mortgage payment does not fit the house.
What renting actually buys
Rent is not thrown away; it purchases things with real financial value. Mobility — the ability to take a better job in another city on 60 days' notice, without a 9% transaction toll. Predictable costs — the roof year is the landlord's problem, so a renter's worst month is a known number. No concentration risk — the owner in the worked example has roughly $52,000, and eventually far more, in a single asset on a single street in a single metro, while the renter's $52,000 can sit in a diversified portfolio. Optionality has a price; for anyone whose job, family, or city might change, renting is often the cheaper way to hold it.
When buying clearly wins
The honest case for buying is strong where its conditions hold. A long horizon — ten years or more — amortizes the transaction toll and lets compounding appreciation work. A stable location and household removes the forced-sale risk that makes leverage dangerous. A fixed-rate payment is a hedge against rent inflation: the owner's $2,313 principal-and-interest is the same in year 25 as in year 1, while the example renter is paying $2,870 by year 10 and climbing. Buying also wins on behavior — amortization is saving you cannot skip, and decades of household-wealth surveys show most families accumulate far more through home equity than through voluntary investing; what that equity can later do is covered in how home equity works as a financial asset. And in low price-to-rent metros, buying wins on pure cash flow within a handful of years, no behavioral argument needed.
Nobody can time the housing market
Waiting for prices or rates to fall is a bet, not a plan. Prices: the FHFA index has risen in most years since 1991, including straight through many widely predicted crashes — and 2008, the crash that did come, was predicted by almost no one's timing. Rates: a buyer who waits for 5% may get it next year or in six; meanwhile rent is due monthly. The defensible move is to decide on horizon and price-to-rent, the two variables that dominate the math you can actually know, and treat future rates as a refinancing option: buy when the numbers work at today's rate, and if rates fall later, refinance into the better one. What you should not do is stretch into an adjustable-rate loan purely to manufacture affordability at the teaser rate — the risks are covered in our entry on adjustable-rate mortgages.
Common mistakes on both sides
- Comparing rent to the full mortgage payment — the principal slice is saving, not cost; compare unrecoverables.
- Buying with a horizon under five years because "we're tired of renting" — the transaction toll almost guarantees a loss.
- Counting the mortgage payment as the cost of owning and budgeting nothing for the $8,600 of first-year tax, insurance, and maintenance in the example.
- Assuming the tax deduction is worth thousands when the standard deduction already covers most or all of it.
- Renting and spending the difference — the renter's win in the seven-year verdict exists only if the $52,000 and the monthly gap are actually invested.
- Draining every account for the down payment, leaving no buffer for the roof year — the classic path from homeowner to forced seller.
- Extrapolating your metro's last five years of appreciation forward — the FHFA long-run average is 4.26%; recent hot streaks revert.
Renting vs buying a home: the decision framework
Strip the analysis to what you can actually know today, and the decision is three questions: How long will I realistically stay? What is my market's price-to-rent ratio? Would I truly invest the difference?
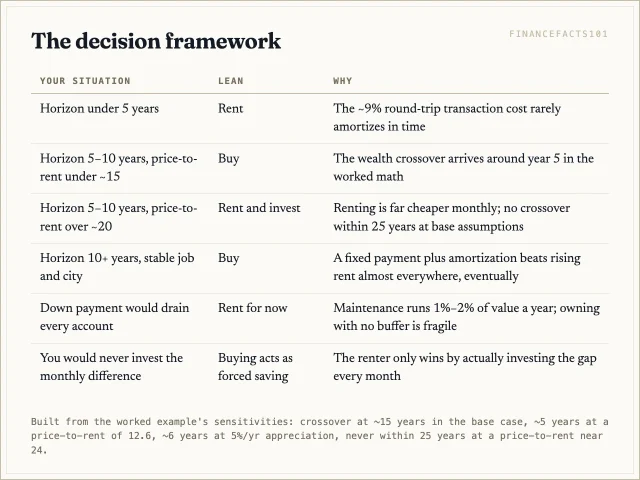
The worked example's deepest lesson is that the answer is conditional, and the conditions are knowable. Under five years, rent — in nearly any market. Past ten years in a stable life, buy — in nearly any market. In between, the price-to-rent ratio and your own investing discipline decide it, and a spreadsheet built like this article beats every slogan ever printed on either side.
FAQ
Is renting really throwing money away?
No — rent buys housing, exactly as the owner's interest, taxes, insurance, and maintenance buy housing. In year one of the worked example the owner's unrecoverable costs ($37,069) exceed the renter's ($26,580) by about $10,500. The "thrown away" framing only becomes true over long horizons, where fixed payments and amortization pull the owner's annual burn below market rent.
Does a bigger down payment change the verdict?
It shifts the components more than the total. Twenty percent down removes PMI ($2,160 a year here) and cuts interest, but doubles the capital that could otherwise compound at 7% — in this model the two effects come close to offsetting. What a bigger down payment reliably buys is safety: lower leverage, a smaller payment, and more distance from the underwater scenario in the leverage table.
Should I wait for mortgage rates to drop before buying?
Waiting is a rate bet with rent as the carrying cost. If the math works at 6.66% for your horizon and price-to-rent ratio, buying now keeps a free option: refinance if rates fall. If the math only works at some imagined future rate, the math does not work — buying and hoping is how the leverage table's bottom row happens.
How do I find the price-to-rent ratio where I live?
Take three to five homes like the one you would buy, from current sale listings, and divide the typical price by the annual rent of genuinely comparable rentals nearby. Below roughly 15, run the numbers on buying seriously; above roughly 20, renting and investing likely wins at 2026 rates. One afternoon of listing research produces a more honest answer than any national average, including this article's.
Sources
- Freddie Mac Primary Mortgage Market Survey — 30-year fixed average 6.66%, week of August 27, 2026.
- National Association of Realtors, Existing-Home Sales — median existing-home price $434,100, July 2026.
- FHFA House Price Index — 4.26% average annual US house-price appreciation since 1991.
- HUD Fair Market Rents, FY2026 — median two-bedroom FMR $1,573.
- CFPB, Buying a House — closing costs typically 2%–5% of the loan.
- IRS Topic 501, Standard Deduction and IRS Publication 936, Home Mortgage Interest Deduction.
- Tax Foundation, Property Taxes by State and County — effective rates on owner-occupied housing.
- Bankrate, National Average Cost of Home Insurance — $2,470 per year, 2026.
- FRED, S&P 500 — long-run equity-return context.
- Zumper, Rent vs. Buy in 2026 — metro price-to-rent estimates (San Jose, Pittsburgh).
 Next entry · No. 5,939Emergency Fund: How Much and Where to Keep It
See also
-
 No. 5,945
14 Sep 2026
18 min
How Much House Can I Afford? Approval Price vs Affordable Price
Real Estate
-
 No. 5,933
05 Sep 2026
15 min
15-Year vs 30-Year Mortgage: The Total-Cost Math
Real Estate
-
 No. 3,394
24 Mar 2025
21 min
Understanding Negative Equity: The Financial Implications for Homeowners and the Economy
Real Estate
-
 No. 5,967
01 Oct 2026
12 min
2-1 Buydown: What a Seller-Paid Teaser Rate Is Actually Worth
Mortgage
-
 No. 5,966
30 Sep 2026
12 min
Assumable Mortgage Value: What a 3% Loan Is Worth in a 6.76% Market
Mortgage
-
 No. 5,960
24 Sep 2026
12 min
10% vs 20% Down: What the Extra $40,000 Is Actually Worth
Mortgage