How Much Do I Need to Retire? Spending, Social Security and the 4% Rule
How much you need to retire: 25 to 33 times the spending savings must cover after Social Security. A $90,000 couple with $49,200 of benefits needs $1.12M.
How much do I need to retire? As of October 2026, the defensible answer is 25 times the yearly spending your savings must cover after Social Security, rising to about 33 times if you retire early or want a wider margin. For the worked couple below, who spend $90,000 a year and expect $49,200 of Social Security, that comes to about $1.12 million in traditional 401(k) and IRA money, or $1.02 million if every withdrawal came tax-free from a Roth, in 2026 dollars.
The rest of this guide covers the inputs: which spending number to use, how to subtract Social Security, what the 4% rule behind "25 times" actually tested, and the four things it leaves out: bad early returns, inflation, health insurance before 65, and income tax.
One line of scope honesty: this is general information built on stated assumptions (a named household, 2026 tax law and SSA's 2026 figures), not personal advice. Swap in your own numbers wherever they differ.
Who this is for — and who it is not for
This is for a US worker or couple within about 25 years of retiring whose savings sit mainly in a 401(k), IRA or brokerage account, with Social Security as the main guaranteed income.
It is not the right tool if a pension covers most of your spending, if you plan a retirement longer than 40 years, or if your wealth is mostly a business or rental property you will not sell in slices. It also does not decide when to claim Social Security; that trade-off has its own guide.
Start with spending, not an income multiple
The popular shortcut is a multiple of salary; Fidelity's guideline, for example, is 10 times salary by 67. That is a fair checkpoint on the way and a poor finish line, because two households with the same salary can need very different amounts.
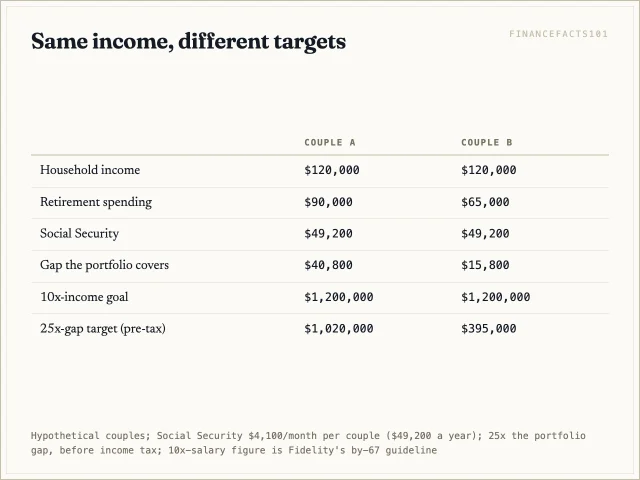
Take two couples who each earn $120,000 and expect $49,200 of Social Security. One spends $90,000 a year, the other $65,000. The income rule gives both a $1.2 million goal; spending-based arithmetic, before tax, says $1,020,000 and $395,000. That difference is the whole plan.
So the unit that matters is annual retirement spending, built from your actual statements and adjusted for what changes when work stops: commuting, payroll tax and retirement saving go away, health care usually rises, and mortgages end on a date you can look up.
How much do I need to retire: the four-step formula
The method has four steps, each a line you can fill in.
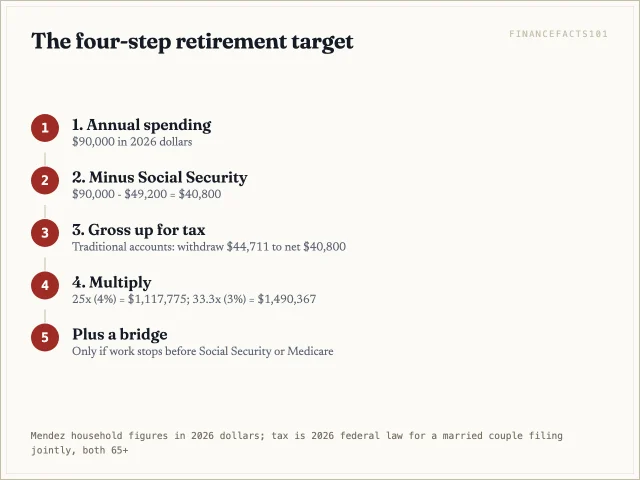
Total your annual spending in 2026 dollars. Subtract guaranteed income that rises with inflation, which for most people means Social Security. Gross up the remainder for income tax if it will come out of traditional accounts. Multiply by 25 (a 4% withdrawal rate), or by up to 33 (3%) if retirement could run longer than 30 years. If you stop work before Social Security or Medicare starts, add a bridge fund on top.
The paired retirement calculator runs steps one, two and four and projects your savings forward; it ignores tax, so enter spending that includes it.
The worked example: the Mendez household
Ruth and Carlos Mendez are both 62 in 2026 and plan to stop working at 67, in 2031, which is also their full retirement age. Their house is paid off. Here is their retirement budget in 2026 dollars.

The health line assumes Medicare from 65: two standard Part B premiums at the 2026 rate of $202.90 a month come to $4,870 a year, and they budget $7,930 more for supplemental coverage, drug plans and out-of-pocket costs. Total spending: $90,000.
Their SSA statements estimate $2,500 a month for Carlos and $1,600 for Ruth at 67: $49,200 a year together. That leaves $40,800 a year for the portfolio, after tax.
All of their savings are in traditional 401(k)s and IRAs, so every dollar withdrawn is taxable. To net $40,800 they must withdraw $44,711 a year, of which $3,911 goes to federal income tax (the calculation is in the tax section below). Multiply by 25 and the target is $1,117,775. Had the same savings been in Roth accounts, it would be 25 × $40,800 = $1,020,000.
Subtract Social Security with SSA's own number
Social Security pays for life and adjusts for inflation, so every dollar of it is a dollar of spending the portfolio does not have to cover, times 25.
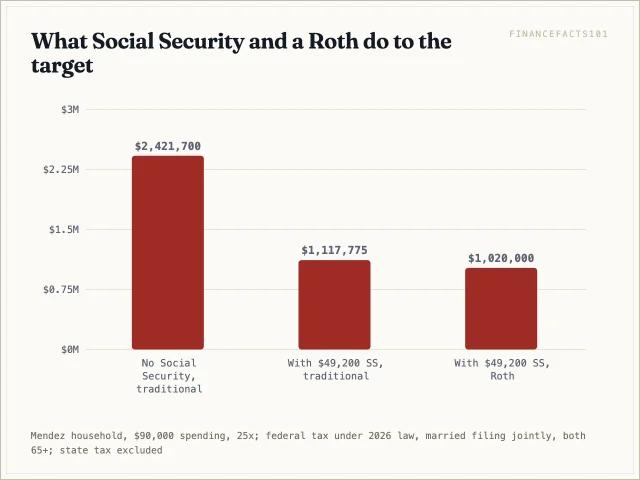
For the Mendezes, dropping Social Security from the plan would raise the traditional-account target from $1,117,775 to $2,421,700. The benefit is doing more than $1.3 million of work.
Use your own figure, not an average. SSA's 2026 COLA fact sheet puts the estimated average retired-worker benefit at $2,071 a month after the 2.8% cost-of-living increase, $3,208 for an aged couple both receiving benefits, and $4,152 as the maximum for a worker retiring at full retirement age in 2026. SSA's own Retirement Ready fact sheet says that on average the benefit replaces about 40% of pre-retirement earnings, which is why it cannot be the whole plan.
Your personal estimate is in your statement at my Social Security. For a rough figure without logging in, SSA's Quick Calculator estimates your earnings history from what you enter rather than reading your record, and SSA calls its results rough. Two cautions apply. Statement estimates assume you keep earning at your latest level until you start benefits, so stopping work earlier can lower the number slightly. And claiming age changes the benefit by up to roughly 30% early or 24% late, which is why the claiming decision belongs before this calculation, not after it.
On solvency, the 2026 Trustees Report, released June 9, 2026, projects the retirement trust fund (OASI) running dry in the fourth quarter of 2032, with 78% of benefits payable after that if Congress does nothing; combined with disability, it is 2034 at 83%. A cautious stress test cuts the benefit line by a fifth, which adds $9,840 a year to the Mendez portfolio's job before tax.
Where the 4% rule came from: Bengen, 1994
The 4% behind "25 times" comes from one paper. William Bengen, a financial planner, published Determining Withdrawal Rates Using Historical Data in the Journal of Financial Planning in October 1994.
What he tested was narrow: retirees starting each year from 1926 through 1976 withdrew a percentage of the portfolio in year one, then raised the dollar amount with inflation, from a rebalanced mix of large US stocks and intermediate-term Treasuries. His base case was 50% stocks.
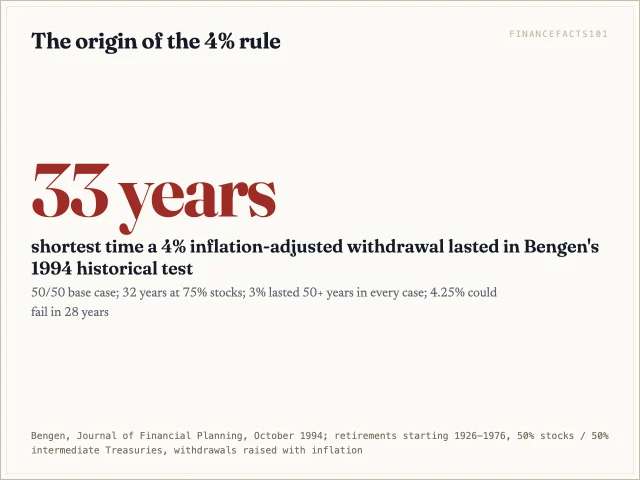
His finding, for that 50% stock base case: a 4% first-year withdrawal "should be safe" for 30 years, because "in no past case has it caused a portfolio to be exhausted before 33 years." At 4.25% a portfolio could run out in as little as 28 years. At 3% every portfolio lasted at least 50 years. He called 5% "risky" and 6% or more "gambling," and recommended 50% to 75% in stocks. He also assumed the money sat in tax-deferred accounts, so the 4% is a pre-tax figure.
What the Trinity study added, and what it did not test
Three Trinity University professors, Philip Cooley, Carl Hubbard and Daniel Walz, published Retirement Savings: Choosing a Withdrawal Rate That Is Sustainable in the AAII Journal, February 1998. Using 1926 to 1995 data, the S&P 500 and long-term high-grade corporate bonds, they counted how many overlapping payout periods each rate survived.
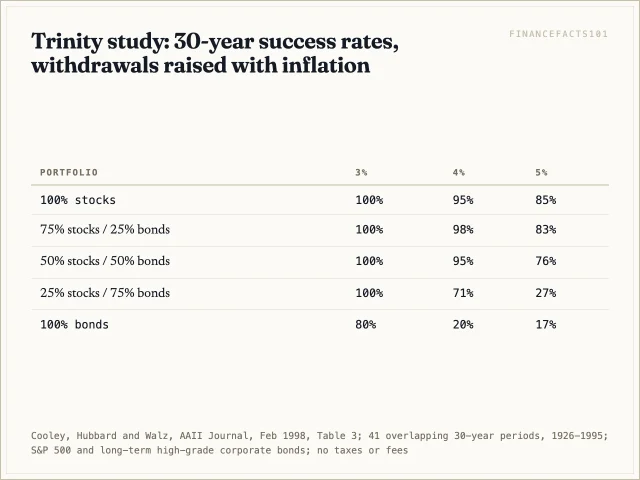
With withdrawals raised for inflation over 30 years, 4% survived 95% of the 41 periods with a 50/50 mix and 98% with 75% stocks. Bond-heavy portfolios did far worse: 71% at 25% stocks and 20% at all bonds. The authors were explicit that the study "did not adjust for taxes or transaction costs," and that early retirees with long payout periods "should plan on lower withdrawal rates."
That is the honest pedigree of the 4% rule: two backtests of one country's markets, over horizons of 30 years at most, before tax and fees. It is a reasonable anchor, not a guarantee.
What newer research says
The most-cited annual update is Morningstar's. Its December 3, 2025 estimate, by Amy Arnott, Christine Benz and Jason Kephart, puts the highest safe starting withdrawal rate for 2026 retirees at 3.9%, assuming fixed inflation-adjusted spending, a 30-year horizon, a 90% probability of having money left, and 30% to 50% in stocks. Unlike Bengen and Trinity, it uses forward-looking return and inflation forecasts rather than history.
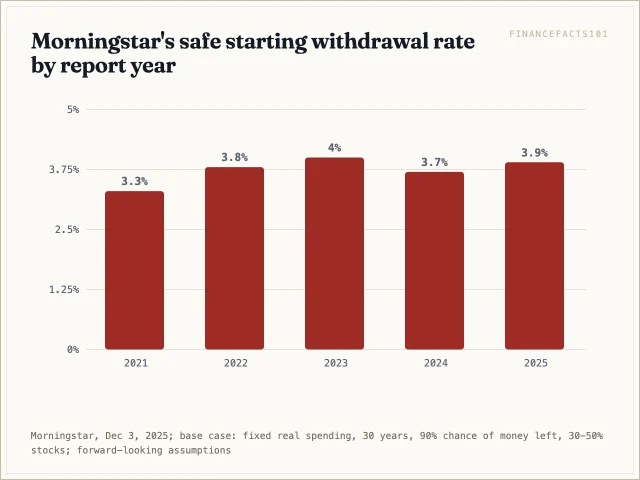
The estimate moves with markets, from 3.3% in 2021 to 4.0% in 2023. The same research found that retirees willing to cut spending in bad years can start at nearly 6%.
Bengen himself has moved the other way. In his 2025 book, A Richer Retirement, as reported by CNBC on September 3, 2025, he puts the historical maximum safe rate, which he calls the "Universal Safemax," at 4.7%, up from the roughly 4% (4.15%, by CNBC's account) his 1990s research pointed to. CNBC adds the necessary caveat: the figure rests on past performance and is not guaranteed for future retirees.
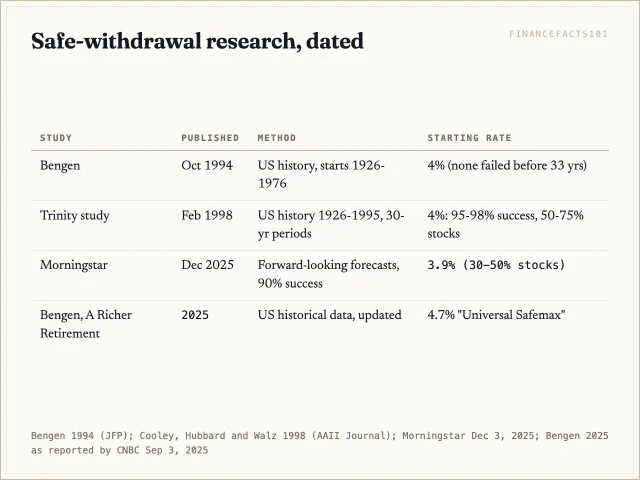
The spread, 3.9% forward-looking to 4.7% historical, is narrower than the debate suggests, which is why 25 times remains the planning anchor.
25x or 33x: choosing your multiple
The multiple is just 1 divided by the withdrawal rate: 25 at 4%, 28.6 at 3.5%, 30 at 3.33%, 33.3 at 3%. Moving from 25 to 33 raises the target by a third.
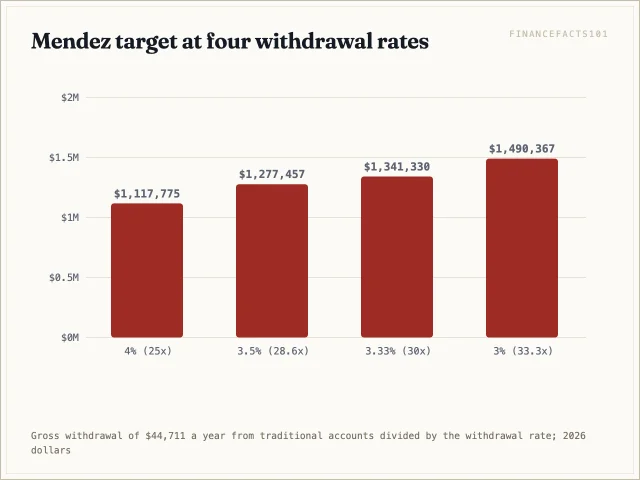
For the Mendezes that is $1,117,775 at 4%, $1,277,457 at 3.5% and $1,490,367 at 3%. Four things decide which fits. Horizon: every test above assumed 30 years, and a 55-year-old retiree may need 40. Flexibility: if you can cut spending 10% after a bad year, 25x is defensible. Guaranteed income: the more Social Security covers, the less a shortfall hurts. Legacy: wanting to leave money argues for the higher multiple.
A workable rule: 25x at 65 or later with some spending flexibility; 28x to 30x for retirement in your early 60s or rigid spending; 33x for retirement before 55 or when the portfolio covers nearly everything.
Sequence-of-returns risk: why the first decade decides
Average returns do not decide whether a retirement works; the order does. Early losses force you to sell more shares for the same withdrawal, and those shares miss the recovery.
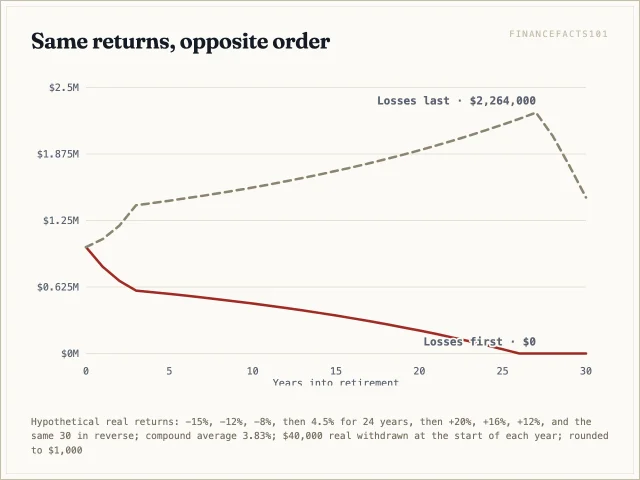
The chart runs one $1,000,000 portfolio paying $40,000 a year, adjusted for inflation, through the same 30 annual real returns in opposite orders, a compound average of 3.83% a year both ways. With the losses first, the portfolio is down to $591,000 after three years and runs dry in year 27. With the losses last, it holds $1.39 million after three years and ends at $1.47 million. Same returns, same spending, opposite outcomes.
Bengen's worst historical start fits the pattern: 1966, whose first decade ran into the 1973–74 bear market and high inflation. The defenses: hold a few years of withdrawals in bonds or cash so you are not forced to sell stocks after a crash, keep costs low with broad index funds or ETFs, and agree in advance on a spending cut if the portfolio falls by a set amount.
Inflation: the rule's hidden assumption
The 4% rule already raises withdrawals with inflation every year, which is why it starts so low. It cannot rescue a plan built on a spending figure that is already stale. The CPI rose 3.4% in the 12 months to August 2026, according to BLS's September 11, 2026 release, above the 2.46% long-run inflation assumption in Morningstar's research.
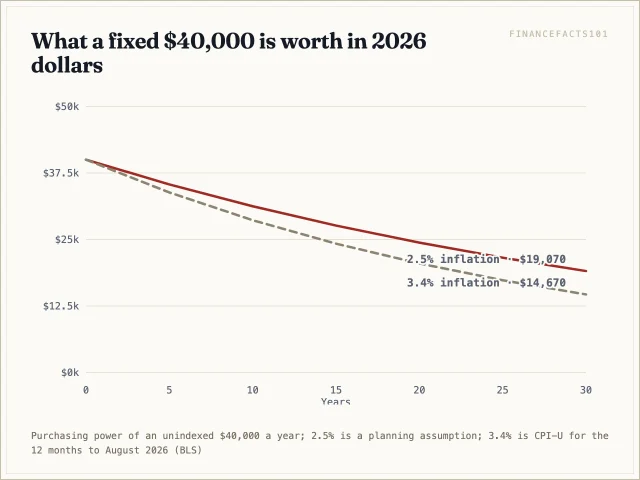
At 2.5% inflation, a fixed $40,000 is worth $21,576 in 2026 dollars after 25 years; at 3.4%, $17,340. Social Security's COLA, tied to the CPI-W, is why subtracting the benefit at full value is fair. A pension with no cost-of-living adjustment shrinks the same way, so subtract only part of it.
Keep the target in 2026 dollars and let the calculator inflate it. Enter the Mendezes in the retirement calculator (age 62, retiring at 67, $93,911 of spending including tax, $4,100 a month of Social Security, 2.5% inflation) and it shows $1,264,660 in 2031 dollars: the same $1,117,775 at today's prices.
Healthcare before Medicare at 65
Medicare covers people 65 or older; younger people qualify only with certain disabilities, end-stage renal disease or ALS. SSA's fact sheet advises signing up three months before turning 65 to avoid a lifelong penalty, with special rules if you have coverage through work. Anyone retiring earlier has to buy coverage, usually on the ACA Marketplace.
That got more expensive in 2026: the enhanced premium tax credits expired at the end of 2025, so the credit again stops at 400% of the poverty line. Per HealthCare.gov, households between 100% and 400% qualify; the two-person line used for 2026 Marketplace savings is $21,150, putting a couple's cliff at $84,600 of modified adjusted gross income (48 states and DC). For a single person the line is lower: KFF's analysis found that in 19 states, a single 60-year-old at 401% of poverty ($62,757) would pay more than 25% of income for a benchmark silver plan.

Suppose the Mendezes stopped at 62 instead. They would need a bridge: three years at $113,200 (their $90,000 budget with $36,000 of private coverage and out-of-pocket costs replacing the $12,800 Medicare line), plus two years at $90,000 before Social Security, for $519,600. The core pot must still reach $1,117,775 at 67; if it grows 5% a year after inflation untouched, $875,806 at 62 is enough. Total at 62: $1,395,406 before tax on the bridge withdrawals, against $1,117,775 at 67.
The $36,000 is an assumption. Drawing the bridge from cash, Roth contributions or low-gain taxable holdings keeps MAGI low and can bring the tax credit back.
Taxes: traditional dollars are not Roth dollars
Neither study counted tax, so the 4% is a gross withdrawal, and what you can spend depends on where the money sits. Traditional 401(k) and IRA withdrawals are ordinary income; IRS Publication 590-B calls them fully taxable when you have no after-tax basis. Qualified Roth distributions are tax-free. Taxable brokerage accounts sit between: you owe tax only on the gain.

Here is the Mendez arithmetic under 2026 law. The 2026 standard deduction for a married couple is $32,200, and Revenue Procedure 2025-32 adds $1,650 for each spouse 65 or older, for $35,500. Social Security becomes taxable once "provisional income" (other income plus half the benefit) passes $32,000 for a joint return, with up to 85% taxable above $44,000, per IRS Publication 915. Their $44,711 withdrawal plus $24,600 of half-benefit makes $69,311, so $27,514 of benefits is taxable. Adjusted gross income is $72,225; taxable income is $36,725; tax is 10% of $24,800 plus 12% of $11,925, or $3,911.
Two details matter. In this range each extra $1,000 withdrawn costs $222 of tax, not $120, because it also pulls $850 more of Social Security into income. And the $32,000 and $44,000 thresholds are fixed dollar amounts in IRC §86(c), not indexed to inflation, so a growing share of benefits becomes taxable over time. We left out the $6,000-per-person senior deduction because it applies only for 2025 through 2028, before the Mendezes retire, and state income tax, which varies by state.
With Roth money the same spending needs $40,800, no tax, and no taxable Social Security: $97,775 less saved. That is not a reason to convert everything: the Roth vs traditional IRA guide shows the winner depends on whether your tax rate is higher now or in retirement. The point here is narrower: size a traditional-account target on gross withdrawals.
If you are short: the levers that move the number
Work one more year and three things happen at once: another year of saving, one less year of withdrawals, and a larger benefit if you also delay claiming. Cut planned spending by $5,000 and the target falls by at least $125,000 at 25x. Collect every dollar of employer match first; the 401(k) employer match guide prices the free money you leave behind by deferring too little.
If you are decades away, the Coast FIRE calculator turns the target into a number for today: at a 5% real return, $1,117,775 needed in 27 years is $299,394 invested now. Retiring early has a tax catch: before age 59½, withdrawals from IRAs and plans generally carry a 10% additional tax unless an exception applies, such as leaving an employer in or after the year you turn 55 for that employer's plan.
The decision, step by step

Run it once with your own numbers, then again with a 20% cut to Social Security and a 3.5% withdrawal rate. If both are within reach, the plan is sound. If only the first is, the gap between them is your margin for error, and the levers above close it.
FAQ
Is $1 million enough to retire?
It depends on spending and Social Security, not on the round number. At a 4% withdrawal rate, $1 million in traditional accounts supports $40,000 a year before tax. For a married couple, both 65 or older, with the Mendezes' $49,200 of Social Security, that supports about $86,300 of total spending after federal tax under 2026 brackets, or about $87,600 while the $6,000-per-person senior deduction applies (2025 through 2028). A single retiree on $2,071 a month, the 2026 average benefit, who wants to spend $80,000 would need well over $40,000 from the portfolio, so $1 million falls short.
Is the 4% rule still valid in 2026?
As a planning anchor, yes: Morningstar's December 2025 estimate for 2026 retirees is 3.9%, and Bengen's 2025 historical update is 4.7%. But the original tests covered 30 years of US markets with no taxes or fees, so an early retirement or a wish for margin argues for 3% to 3.5%.
How much do I need to retire at 55?
More than at 65, on three counts: a longer horizon (use 28x to 33x), a longer wait for Social Security, and ten years of health insurance before Medicare. The extra years come from a separate bridge fund, as in the Mendez example, and early IRA and plan withdrawals can carry a 10% additional tax unless an exception applies.
Sources
- SSA, 2026 Cost-of-Living Adjustment (COLA) Fact Sheet: 2.8% COLA; average benefits of $2,071 and $3,208; $4,152 maximum at full retirement age
- SSA, Retirement Ready fact sheet for workers ages 61-69 (April 2025): benefits replace about 40% of pre-retirement earnings; Medicare sign-up timing
- SSA, my Social Security: personal benefit estimates
- SSA, Social Security Quick Calculator
- SSA, Trustees Report press release, June 9, 2026: OASI depletion in late 2032 at 78% payable; combined funds 2034 at 83%
- IRS, Tax inflation adjustments for tax year 2026: standard deduction and brackets
- IRS, Revenue Procedure 2025-32: $1,650 additional standard deduction for age 65
- IRS, Publication 915, Social Security and Equivalent Railroad Retirement Benefits: $32,000 and $44,000 joint thresholds
- IRS, Publication 590-B, Distributions from IRAs
- IRS, Roth IRAs
- IRS, Tax deductions for working Americans and seniors: $6,000 senior deduction, 2025 through 2028
- IRS, Exceptions to tax on early distributions
- Medicare.gov, Get started with Medicare and Medicare costs: 2026 Part B premium of $202.90
- HealthCare.gov, Federal poverty level: 100% to 400% eligibility; $21,150 for two
- Bureau of Labor Statistics, Consumer Price Index, August 2026 (released September 11, 2026)
- William P. Bengen, Determining Withdrawal Rates Using Historical Data, Journal of Financial Planning, October 1994 (2004 reprint)
- Cooley, Hubbard and Walz, Retirement Savings: Choosing a Withdrawal Rate That Is Sustainable, AAII Journal, February 1998
- Morningstar, What's a Safe Retirement Withdrawal Rate for 2026? (December 3, 2025)
- CNBC, 4% rule inventor William Bengen on inflation (September 3, 2025)
- KFF, Mapping the uneven burden of rising ACA Marketplace premium payments
- Fidelity, How much do I need to retire?: 10x salary by 67 guideline
 Next entry · No. 5,974Term vs Whole Life Insurance: Which Is Better for Me?
See also
-
 No. 5,944
14 Sep 2026
18 min
When to Claim Social Security: Break-Even at 62, 67 and 70
Retirement
No. 5,944
14 Sep 2026
18 min
When to Claim Social Security: Break-Even at 62, 67 and 70
Retirement -
 No. 5,970
04 Oct 2026
17 min
Required Minimum Distributions: When to Start, How Much, and How to Cut the Tax
Retirement
No. 5,970
04 Oct 2026
17 min
Required Minimum Distributions: When to Start, How Much, and How to Cut the Tax
Retirement -
 No. 5,969
03 Oct 2026
19 min
Should I Do a Roth Conversion in 2026? How Much to Convert
Retirement
No. 5,969
03 Oct 2026
19 min
Should I Do a Roth Conversion in 2026? How Much to Convert
Retirement -
 No. 5,950
17 Sep 2026
17 min
Thrift Savings Plan: How Much to Contribute, Which Fund, and Whether to Roll It Out
Retirement
No. 5,950
17 Sep 2026
17 min
Thrift Savings Plan: How Much to Contribute, Which Fund, and Whether to Roll It Out
Retirement -
 No. 178
07 Apr 2024
21 min
Understanding Annuitization: The Process of Converting an Annuity Investment into Income Payments
Retirement
No. 178
07 Apr 2024
21 min
Understanding Annuitization: The Process of Converting an Annuity Investment into Income Payments
Retirement -
 No. 5,931
03 Sep 2026
14 min
Roth vs Traditional IRA: Which Saves You More Tax
Taxation
No. 5,931
03 Sep 2026
14 min
Roth vs Traditional IRA: Which Saves You More Tax
Taxation